Can RSI Positive Divergence Truly Predict Market Bottoms?
Nov 20, 2024
Imagine standing on the precipice of a financial crisis, watching markets tumble while fear grips every investor’s heart. Would you dare to buy when others are panic-selling? The concept of buying low when despair is rampant challenges conventional wisdom, yet history shows that those who recognize the signs of a market bottom can reap substantial rewards. One such sign is the Relative Strength Index (RSI) positive divergence. But can this technical indicator truly predict market bottoms?
Understanding RSI Positive Divergence
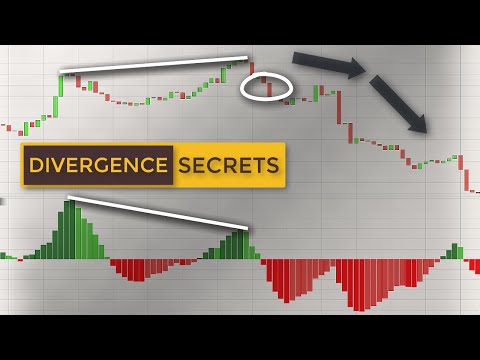
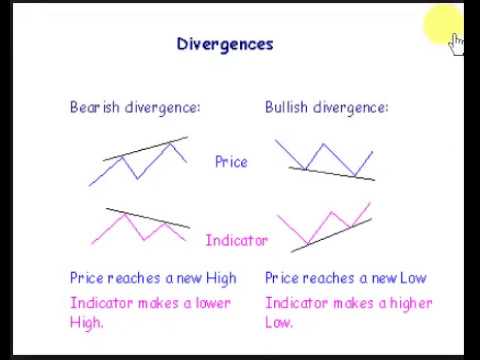
The Relative Strength Index (RSI) is a momentum oscillator used in technical analysis to measure the speed and change of price movements. It oscillates between zero and 100, providing signals of overbought and oversold conditions. A positive divergence occurs when the RSI indicator rises while the price of the asset continues to fall. This suggests that the selling pressure is weakening, and a reversal may be imminent.
For example, during a prolonged downtrend, prices might reach new lows, but the RSI fails to follow suit and instead forms higher lows. This discrepancy signals that the underlying momentum is shifting, potentially heralding a market bottom.
Markets are not just driven by numbers and charts; they are profoundly influenced by human emotions. Fear and greed often overpower rational decision-making, leading to herd mentality. When panic sets in, investors tend to sell en masse, exacerbating the downturn. Conversely, during euphoric peaks, irrational exuberance can drive prices to unsustainable levels.
Understanding mass psychology is crucial. As Warren Buffett famously said, “Be fearful when others are greedy, and greedy when others are fearful.” Recognizing the signs of fear-driven selling can provide astute investors with opportunities to buy quality assets at discounted prices.
Case Study: The 2008 Financial Crisis
The housing bubble of 2008 serves as a stark reminder of how fear and panic can dominate markets. As housing prices plummeted and financial institutions crumbled, the stock market experienced one of its most significant downturns. Amid the chaos, the RSI for many stocks and indices showed positive divergence.
For instance, the S&P 500 reached new lows in March 2009, but the RSI began to rise, signalling that the downward momentum was waning. Investors who recognized this positive divergence and had the courage to buy during this period were rewarded handsomely as the market embarked on a prolonged bull run in the following years.
Behavioural finance examines how psychological influences affect market outcomes. It highlights biases such as overconfidence, anchoring, and loss aversion, which can lead to irrational investment decisions. By understanding these biases, investors can better interpret market signals like RSI positive divergence.
When the majority are selling due to fear of further losses, the savvy investor looks for technical indicators that suggest the selling pressure is overdone. RSI positive divergence becomes a tool to counteract emotional biases, allowing for more objective decision-making.
Contrarian Thinking and Its Rewards
Contrarian investors go against prevailing market trends, buying when others are selling and vice versa. This approach requires confidence and discipline, as it often involves acting against one’s instincts and the crowd’s sentiment.
By incorporating RSI positive divergence into their analysis, contrarians can identify potential market bottoms. This strategy isn’t without risks, but history has shown that those who buy during periods of widespread pessimism often achieve significant long-term gains.
Technical Analysis: Beyond the RSI
While RSI positive divergence is a valuable indicator, relying on it exclusively can be perilous. Combining it with other technical tools, such as moving averages, support and resistance levels, and volume analysis, can enhance its predictive power.
For example, if RSI positive divergence coincides with a stock reaching a long-term support level and a spike in trading volume, the convergence of these signals may strengthen the case for a market bottom.
The importance of timing in investments cannot be overstated. Entering the market too early or too late can significantly impact returns. Technical indicators like RSI positive divergence aim to provide clues about the optimal entry points.
However, timing the market perfectly is a daunting task. It’s essential to approach such indicators with caution, using them as part of a broader investment strategy rather than as definitive signals.
Lessons from the Dot-Com Crash
The dot-com bubble of the late 1990s and its subsequent crash offers another example of herd mentality and its consequences. As internet-based companies soared to astronomical valuations, euphoria drove investors to pour money into unproven ventures.
When the bubble burst, many lost fortunes. Yet, amidst the wreckage, positive divergences in the RSI of certain resilient tech stocks indicated that a bottom was forming. Investors who identified these signs and invested in viable companies like Amazon and Apple reaped significant rewards in the years that followed.
Maintaining emotional discipline is a cornerstone of successful investing. Markets are inherently volatile, and reacting impulsively to short-term fluctuations can lead to poor decisions.
By integrating technical indicators like RSI positive divergence with an understanding of mass psychology, investors can mitigate the influence of emotions. This balanced approach enables more rational decision-making, increasing the likelihood of long-term success.
Caveats and Considerations
While RSI positive divergence can be a potent tool, it’s not infallible. False signals can occur, and markets may continue to decline despite positive divergences. Therefore, it’s crucial to manage risk through diversification, stop-loss orders, and other risk management techniques.
Moreover, understanding the broader economic and geopolitical factors influencing the market is essential. Technical indicators should complement, not replace, fundamental analysis.
Conclusion: Rethinking Investment Strategies
Can RSI positive divergence truly predict market bottoms? While it offers valuable clues, it’s not a crystal ball. However, when combined with an understanding of mass psychology, behavioural finance, and sound risk management, it becomes a powerful component of an investor’s toolkit.
History has shown that those who navigate market swings with confidence and clarity, challenging conventional thinking and resisting herd mentality, are often rewarded. By embracing a strategic approach that integrates technical analysis and psychological principles, investors can better position themselves to capitalize on market bottoms and protect gains during peaks.
In a market dominated by fear and euphoria, the ability to remain objective and recognize opportunities where others see only risk is a mark of true investing acumen. RSI positive divergence is one such opportunity—a signal that, when interpreted wisely, can guide investors through the tumultuous seas of market cycles.
The next time the markets are awash with panic or brimming with irrational exuberance, consider the lessons of the past. Look beyond the noise and trust in disciplined analysis, and you may find that the answers lie not in following the crowd but in understanding the subtle indicators that others overlook.