
Bear Market History: Unveiling the Past’s Lessons
Updated July 2024
Examining this concept in light of historical events, the financial crash of March 2009 is a prime example. This demonstrates that bear markets are a foundation for the next bull market.
In the annals of financial history, bear markets have often been painted as harbingers of doom, periods of economic downturn that incite fear and uncertainty. Yet, a discerning examination of these periods reveals a different narrative that underscores the potential of bear markets as fertile grounds for investment opportunities.
Bear markets, characterized by a 20% or more drop in stock prices, are not anomalies but integral parts of the economic cycle. They are the financial world’s version of the natural world’s forest fires, clearing out the old, weak, and overgrown to make way for new growth. The ashes of one era become the fertile soil for the next, and so it is with bear markets. They are the crucibles in which the next bull markets are forged.
The key to unlocking the potential of bear markets lies in understanding the principles of mass psychology and contrarian investing. Mass psychology, the study of collective human behaviour, plays a significant role in financial markets. During bear markets, the crowd’s sentiment often swings towards extreme pessimism, leading to panic selling. While seemingly chaotic, this mass exodus from the market presents a golden opportunity for the contrarian investor.
Bear Market History: Contrarian Investing and the Path to Opportunity
Contrarian investing is a strategy that involves going against prevailing market trends. The contrarian investor buys with conviction when the crowd is selling in fear. This approach is not for the faint-hearted, as it requires a strong belief in one’s analysis and the courage to act against the crowd. However, history has shown that those who dare to be different often make the greatest fortunes in the ashes of bear markets.
The lessons from bear market history are clear. They are not periods to be feared but opportunities to be seized. They are the moments when the crowd’s fear and pessimism peak and the contrarian investor finds the most significant opportunities. The key is understanding mass psychology’s dynamics, having the courage to act against the crowd, and seeing the potential where others see only peril. Ultimately, bear markets are about survival, thriving, and laying the foundation for future prosperity.
In the context of bear market history, always remember: ‘Your best ally is the prevailing trend.

Bear Market History: Experts and the Overlooked Birth of New Bulls
First and foremost, whenever self-proclaimed experts declare the Dow in a bear market, it’s wise to chuckle at their folly. These so-called experts often reveal themselves to be nothing more than misguided individuals. History shows that every bear market births a resilient bull market. Ironically, the moment of maximum pessimism—when doomsayers abound—is often the most suitable time to embrace the stock market. As the masses succumb to panic and hasty decisions, a discerning investor seizes the chance to dive in vigorously. The adage “buy when there’s blood in the streets” resonates for a reason—it signifies when fortunes can be made. And if the blood happens to be your own, it’s a signal to double down and reap the rewards.
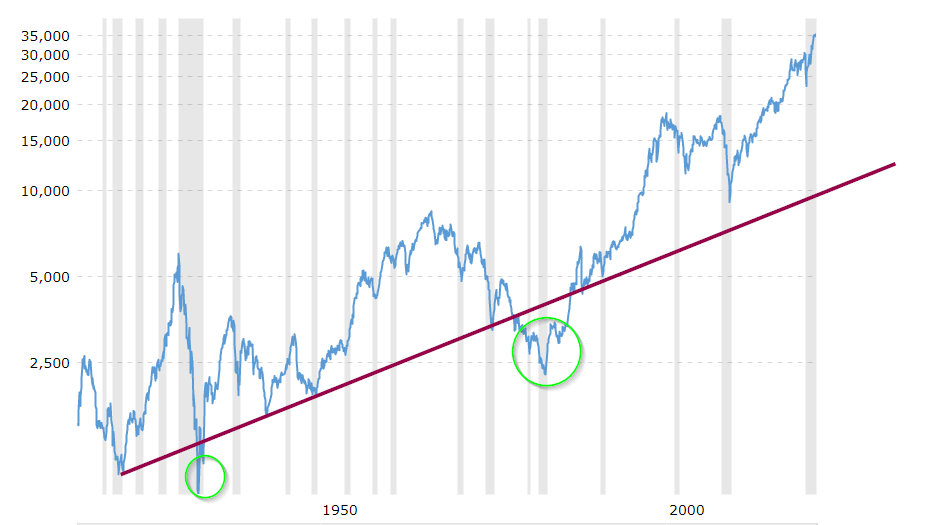
Understanding Dow’s Long-Term Chart: The Evolution of Bear and Bull Markets
This extensive Dow chart refutes notions that bear markets spell the end of investment cycles. Contrary to such theories, bear markets often herald the dawn of robust bullish phases. Occasionally, these bullish surges endure delayed birthing pains as the nascent bull cautiously paces before its grand entrance. The bull’s delayed manifestation breeds a more formidable and enduring market surge, exemplified by the potent bull run that followed the 2009 crash.
This is a crucial reminder that in a world where fiat currency reigns, every correction or crash, regardless of its magnitude, terminates. The reason lies in the essence of inflationary environments, where investment in assets outpacing the central bankers’ efforts to deflate the national currency thrives as the sole profitable path.
Have you ever wondered about the origin of market crashes? They are not merely capricious acts by financial sharks. These players, with vast resources, orchestrate crashes strategically to infuse capital into the market. The timing for these manoeuvres is critical—it takes time to deploy substantial sums into the market, just as it does to withdraw them. Consequently, markets are often driven higher than natural levels to accommodate these transactions.
Moving forward, our focus shifts to historical events, aiming to illuminate how bear markets inherently pave the way for enduring investment prospects.
Market Analysis: Trends, Indicators, and Potential Opportunities
So far, we have just broken below the 4th branch, which is understandable and expected since the market has reached insane levels. But take a look at the chart. We could not even break or touch it below the 3rd-up trend line. This means that this market still has plenty of life in it, and all it did so far was wring out a fraction of its excesses. The NASDAQ had a more severe correction, and the reason is simple: the NASDAQ went from a place where one speculates to a place where one started to imagine if one was under the influence of some powerful hallucinogenic drug.
Take a long-term look. This pullback has been relatively mild and, in reality, nothing to worry about. The new thrill-seeking investors, who were so busy getting high every day as they saw their portfolios soar in value every week, got smashed with a super dose of reality when the market decided it was time to take a breather and rid itself of some of the excesses. And since the NASDAQ was where speculation was the most rampant, it follows that it should also be where the correction would be the strongest and the fastest.
We have not even touched 7,000 nor breached it. Had we done so, this would have indicated further weakness. If we had violated it, we would have to break below 5,000 to invalidate the second main super-up trend line.
Current Market Analysis: Signs of Bullish Momentum and the Role of Gold
So, where do we stand now? If you look closely, it seems like we are in the process of completing a wedge formation, which will be very bullish if we break out of it. In addition, we are slowly making higher lows, which is another bullish indicator. Another significant bullish indicator is that the number of new highs has seriously outpaced the number of new lows for over six months. This shows that the markets’ internals are improving and getting stronger.
What is very interesting is that Gold is also putting in an excellent wedge formation when priced in South African Rands, which adds further credibility to the theory that the Dow is doing nothing but adjusting to the high level of currency inflation. I spoke about this in my previous essay, Insanity is Prevalent.
So, in the short term, gold and equity markets will keep chugging. However, Gold will be the final Victor since it has just begun its primary uptrend.
Based on the provided data, the following conclusions can be drawn.
The Following Excerpt: A Glimpse into November 2009 Market Insights for Our Subscribers
A pullback within the range of 8,800 to 9,000 would provide a healthy dynamic for the market. However, a retraction to the 9,400 to 9,500 range would meet the minimum criteria to initiate the next rally phase. The exceptional aspects of the ongoing rally are somewhat subdued when viewed through the lens of a stronger currency, as discussed in my earlier piece, “The Hidden Truth of the Gold Markets.”
In essence, much of this movement can be attributed to currency fluctuations, particularly the significant depreciation of the US dollar. The market adjusted itself to accommodate this inflationary environment. (With an influx of hundreds of millions or billions of dollars pursuing the same stock pool, it’s logical that demand levels would shift.)
The prospects become intriguing if we can maintain levels between 8,800 to 9,000. Based on trend indicators, the following targets could come into play, assuming the ranges above are upheld:
1st target will be a break of the Dow over the 10,000 range
2nd target 10,500
3rd target 11,400
Extreme target 11,7000
Anticipating the Crash and Burn: Market Corrections and Potential Scenarios
Following this phase, what I refer to as the “crash and burn” process begins, characterized by the market undergoing a correction and reverting to a more reasonable level. However, before this occurs, a substantial level of distress will likely be experienced—an intensity of discomfort that might be deemed “insane.” In light of this, it’s conceivable that the market could ultimately find itself within a range of 1,500 to 4,000 points when all factors are considered.
Naturally, it’s essential to acknowledge that a significant terrorist event could drastically impact the market, causing it to plummet. Unfortunately, no timing system can effectively predict the actions of such irrational extremists. (Hence, holding even more Gold and Silver bullion as a safeguard is imperative.)
As John Maynard Keynes puts it, “Markets can remain irrational longer than you can remain solvent.”
And if you are nervous about the markets, then listen to Mark Twain:
“October. This is one of the peculiarly dangerous months to speculate in stocks. The others are July, January, September, April, November, May, March, June, December, August, and February.” Mark Twain 1835-1910
Embracing a Contrarian Perspective: Exploring Alternative Views
For those who identify as contrarians, I invite you to pause and reflect on this alternate viewpoint. It’s essential to recognize that I’m not forcefully advocating for these opinions; instead, I’m offering alternative scenarios beyond the ones you might have encountered thus far. It’s crucial not to dismiss the messenger solely because the message doesn’t align with your preconceived expectations. Open-minded consideration can lead to valuable insights.

Delectable Articles for the Inquisitive Reader