
A wise man is he who does not grieve for the thing which he has not but rejoices for those which he has. Epictetus
BBC Global 30 Index
Updated Oct 2023
The most effective method of learning is by studying history, which grants us the opportunity to explore alternative and proactive approaches that can lead to favourable outcomes when faced with similar situations. That’s precisely why we are delving into this topic within a historical context. In 2023, there is a strong possibility of a recurrence of this pattern, and it is likely to persist well into 2024.
The Global BBC 30 Index, based on the economic data of 30 of the world’s largest companies, is considered by some experts as providing a more accurate reflection of market conditions compared to other indices like the NYSE. However, it’s essential to exercise caution and avoid over-reliance on any single index, especially in a world where market manipulation is a concern.
While the Global BBC 30 Index may offer valuable insights, it’s essential to consider other factors and indicators to make well-informed trading decisions. Volatility, as indicated by the surge in volatility levels, is a critical consideration for traders. The mention of the Market Volatility indicator (V-indicator). Suggests that it was able to predict the increase in volatility.
Traders should employ a comprehensive approach that combines various indicators, fundamental analysis, news events, and risk management strategies to gain a holistic view of the market. By considering multiple sources of information, traders can mitigate potential risks associated with relying solely on a single index or indicator.
Mass Psychology
Examining the situation from a mass psychology perspective can provide insights into the prevailing sentiment and attitudes of the general public. It seems that the overall sentiment is pessimistic, with concerns about worsening economic conditions, low commodity prices, stagnant or declining salaries, and a significant portion of the population living paycheck to paycheck.
During times of pessimism and negativity, there can also be opportunities for those who can identify them. It’s important to note that market sentiments and mass psychology don’t always align perfectly with market outcomes. While the BBC Business Global 30 Index may not indicate an imminent market breakdown, it can provide valuable information about how the world has changed and how the index might behave differently from other national indices.
Regarding the viewpoints of looking at any given situation, it is common for people to fall into one of two categories: those who adopt a negative perspective (glass is half empty) and those who adopt a positive perspective (glass is half full). These viewpoints can influence how individuals perceive and react to market conditions, investment opportunities, and risk.
Every situation can be viewed from three distinct angles, with society often encouraging these perspectives:
1. The pessimistic viewpoint, perceiving the glass as half empty, reflects a negative outlook.
2. The optimistic standpoint, seeing the glass as half full, indicates an optimistic mindset.
3. The crucial realization that neither perspective holds significance. When you’re thirsty, you’ll drink; otherwise, the glass’s state becomes irrelevant.
Rational Analysis of Market Trends
Our perspective on this unique approach to psychology is that it oversimplifies the matter. The sole question that should concern a rational individual is, “Am I thirsty or not?” If you are indeed thirsty, you quench your thirst; if not, you continue with your daily routine.
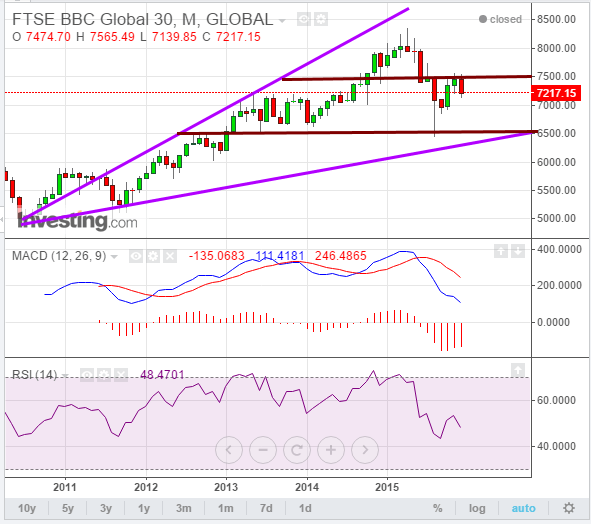
Applying this logic to the chart above, the primary query that should arise is, “Is the trend upward?” The answer is affirmative, considering the index’s consistent upward trajectory over the past five years. Each pullback should be viewed as a potential buying opportunity.
Furthermore, the MACD indicators have yet to reach highly oversold levels, suggesting the need for further consolidation. Given varying economic conditions in different nations, it’s unreasonable to expect this index to keep pace with indices like the Dow and NASDAQ. While there’s a slim chance it could revisit the 6500 range, the most probable scenario involves establishing a higher low.
The optimal scenario envisions a drop to the 6800 range followed by a climb to the 8000 range. Once it closes above 8375 every month, it will set the stage for testing the 9000-9100 levels. Just as past predictions of doom for the NYSE proved erroneous, pessimistic forecasts for the Global BBC 30 index are likely to meet a similar fate.
Let’s delve into a selection of data-driven insights on how one can skillfully integrate a range of strategies with the BBC Global 30 index to increase the likelihood of achieving success in the financial markets.
Revolutionizing Trading with SPY and the 200-day MA
Contrarian trading is all about breaking free from the crowd and seizing opportunities when market sentiment hits extremes. When most traders become excessively optimistic or pessimistic, it can mark the onset of significant market shifts. By embracing contrarian strategies, traders can pinpoint potential market reversals or turning points, specifically when the SPY (S&P 500 ETF) price strays significantly from the 200-day moving average (MA). In these situations, contrarian investors might contemplate selling when the market exudes excessive optimism, with the SPY soaring far above the 200-day MA. Conversely, they might consider buying when the market is drenched in pessimism, and the SPY tumbles considerably below the 200-day MA.
However, it’s essential to recognize that the SPY’s 200-day MA has limitations. This indicator lags behind market movements, reacting to price changes only after the fact. It may not catch swift market shifts or deliver timely signals for short-term traders. Furthermore, relying solely on the 200-day MA without considering other technical indicators or fundamental analysis can result in false signals or missed opportunities.
Mastering Contrarian Strategies with SPY and the 200-day MA
Contrarian trading strategies entail going against the grain to capitalize on extreme market sentiment. One indispensable tool in a contrarian trader’s toolkit is the 200-day moving average (MA). This tool assists in identifying deviations in market sentiment and spotting potential reversal opportunities.
For contrarian traders, extreme levels of bullishness or bearishness can serve as triggers to act contrarily to the prevailing sentiment. When the SPY’s price significantly diverges from its 200-day MA, it can spark contrarian trading signals.
For instance, when market sentiment is excessively bullish, and the SPY is trading well above its 200-day MA, contrarian traders may interpret it as an overbought condition, possibly signalling an impending sell-off. Conversely, when the market sentiment is overly bearish, and the SPY falls significantly below its 200-day MA, contrarian traders may see it as an oversold condition, indicating a buying opportunity.
Understanding the Limitations
While contrarian strategies can be potent, it’s crucial to acknowledge the constraints of relying solely on the SPY’s 200-day MA. This indicator is a trailing one, reacting to price movements only after they’ve already occurred. As a result, it may not capture rapid market fluctuations or provide timely signals for short-term trading. To mitigate this limitation, traders often amalgamate the 200-day MA with other technical indicators and fundamental analysis.
Incorporating Additional Indicators
Contrarian traders typically harness an array of tools and indicators to validate their trading decisions. One common approach involves utilizing oscillators like the Relative Strength Index (RSI) to evaluate overbought or oversold conditions. When the SPY’s price diverges significantly from its 200-day MA and the RSI indicates extreme levels, it can bolster the contrarian signal.
Another method is monitoring volume patterns. Substantial increases in trading volume during periods of extreme bullishness or bearishness can provide supplementary confirmation of a sentiment shift. For example, a surge in volume during an overbought market might signal an impending reversal.
Pairing with Fundamental Analysis
While technical indicators are invaluable, traders often complement them with fundamental analysis. Considerations such as earnings reports, economic data, news events, and industry analysis can offer insights into the intrinsic value and prospects of the securities being traded. By weighing both technical and fundamental aspects, contrarian traders aim to make more informed decisions.
A great fortune in the hands of a fool is a great misfortune.
Anonymous
Discover Fresh Horizons in Stories

Psychology of Cursing: Why Do People Curse So Much?

Spy 200-Day Moving Average: Covert Financial Indicator Unveiled

Black Monday Crash of 1987: Turning Crisis into Opportunity

TGB Stock Price: Riding the Copper Wave with Taseko Mines

Why is the US dollar the Strongest US currency: its deadly effects

Explain Why Diversification Is Such an Important Concept When It Comes to Investing for Your Future

Unearthing the Housing Market Collapse: Learning From The Past

Which of the Following Statements Are True About the Velocity of Money? Let’s Find Out

Exposing the Truth Behind the Infamous Label: Millennials Really Are Dumb

Which of the Following Investing Statements is True? Superior Returns

Catch the Wave: Decoding Trading Cycles with the Esoteric Edge

Copleston and Russell: Dialogue of Great Minds

IBM Stock Price Today NYSE: Finesse in Financial Movements

What Is the Velocity of Money Formula?

Investor Sentiment in the Stock Market: Riding the Right Wave
Stock Market Forecast For the Next 3 Months: Up Or Down?
Fiat Currency: Instruments of Mass Destruction
The Retirement Lie The Masses Have Been Conned Into Accepting
