


The Golden Key: When Rising Bond Yields Become the Signal for What Comes Next
August 12, 2026
The Bond Market Is Telling a Different Story
The stock market receives most of the attention, but some of the most important signals often come from the market nobody wants to discuss until it becomes impossible to ignore. The U.S. Treasury market is one of them, and the relationship between bond prices and yields provides a remarkably clean way to understand what is happening beneath the surface. When Treasury bonds are bought aggressively, prices rise and yields fall; when bonds are sold, prices fall and yields rise, which means a rising 10-year Treasury yield can represent a significant shift in the financial environment even when the Federal Reserve is talking about lower short-term rates.
That distinction is becoming increasingly important because the 10-year Treasury yield sits at the intersection of monetary policy, inflation expectations, government borrowing, economic growth and investor psychology. The Federal Reserve has much greater influence over short-term rates than it does over the 10-year yield, because the longer maturity reflects what investors collectively expect about inflation, growth, future policy and the compensation they require for holding long-duration debt. This creates one of the most interesting divergences in markets: the Fed can cut rates while the 10-year yield rises, meaning the headline story can say “lower rates” while the bond market quietly says something very different.
As of August 2026, the 10-year yield has been trading around the 4.6% to 4.7% region, with recent sessions pushing it toward the upper end of that range. On August 11, reporting placed the 10-year yield around 4.72%, after having moved through 4.7% as markets weighed inflation, oil prices, geopolitical risk and expectations for future Federal Reserve policy.
The Most Important Relationship Is the One People Forget
The mathematics are simple, but the psychological consequences are not. Treasury securities pay a fixed stream of cash flows, so when demand for existing bonds falls, their prices decline and their yields rise to compensate buyers, while stronger demand pushes prices higher and yields lower. That inverse relationship is fundamental, yet investors frequently discuss “rates” as though every interest rate moves together, creating confusion precisely when the distinction becomes most valuable.
The 10-year Treasury is particularly important because it influences a vast range of financial conditions beyond government borrowing. Mortgage rates, corporate financing costs, asset valuations and the discount rates applied to future cash flows are all affected by movements in longer-term yields, although the relationship is not mechanical and other factors can influence each market. A sustained rise in the 10-year yield can therefore tighten financial conditions even if the Federal Reserve is simultaneously reducing its policy rate.
This is where the geometry becomes interesting. The short end of the curve is heavily influenced by what the market expects the Federal Reserve to do, while the long end increasingly reflects what the market believes the future will look like after today’s monetary policy has passed through the economy. If the Fed cuts while the 10-year yield refuses to fall, the bond market may be signalling that investors are demanding more compensation for inflation, debt supply, duration risk or uncertainty about the future.
The Broken Downtrend Matters More Than the Number
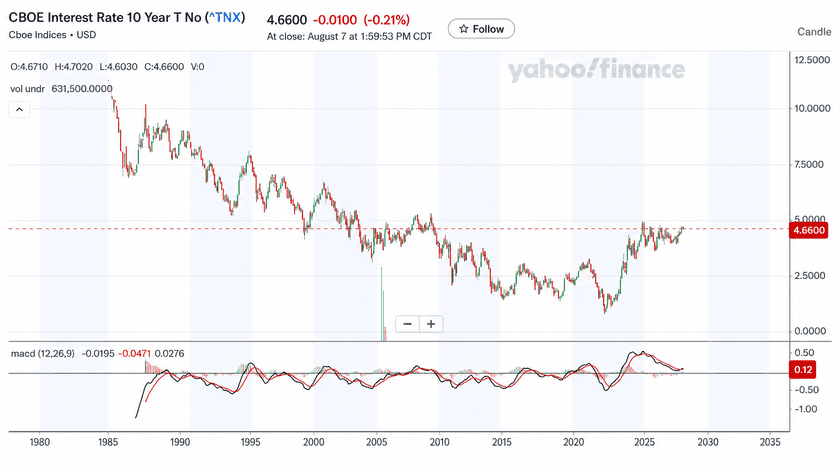
The argument behind the chart is therefore not simply that the 10-year yield is sitting at 4.66% or 4.70%. The more important observation is that a long-term declining trend in yields appears to have been interrupted, followed by consolidation rather than an immediate return to the previous downtrend. If that structure persists, the next significant move could be another leg higher rather than a return to the multi-decade pattern of steadily declining long-term yields.
That is a very different proposition from saying rates must rise indefinitely. Markets rarely move in straight lines, and a technical break can be tested, rejected or completely reversed, which is why the consolidation itself matters. A market that breaks a major trend and then refuses to reverse immediately is telling us that something underneath the old structure may have changed.
There is also a broader historical context. The secular decline in U.S. Treasury yields that dominated much of the period from the early 1980s through the pandemic was supported by falling inflation, disinflationary forces, globalisation, demographic trends and enormous demand for safe assets. The post-pandemic environment has introduced a very different mixture of fiscal expansion, supply-chain restructuring, geopolitical fragmentation, higher government borrowing and uncertainty over the future inflation regime.
That does not guarantee permanently higher yields. It does mean that assuming the old downward trend will automatically reassert itself may be an increasingly dangerous form of backward-looking thinking.
The Fed Can Cut While the 10-Year Goes the Other Way
This is probably the most important concept for anyone trying to understand the current environment. The Federal Reserve controls the federal funds rate, but the market determines the yield on a 10-year Treasury through the collective pricing of future economic conditions, inflation, policy and risk. A policy rate cut can therefore coexist with rising long-term yields if investors believe inflation will remain sticky, fiscal borrowing will remain heavy or future monetary policy will eventually need to be tighter than currently expected.
The result is a strange situation in which the words “rate cuts” can sound bullish while the bond market is simultaneously becoming less accommodating. This is why simply watching the Fed can be insufficient. The bond market frequently provides a more nuanced reading because thousands of institutions are continuously repricing the future rather than simply responding to the latest central-bank statement.
Recent market behaviour illustrates that tension. Treasury yields have been sensitive to inflation expectations and energy prices, with oil and geopolitical developments feeding into concerns about future inflation, while weaker labour-market data has simultaneously increased expectations for easier monetary policy.
That conflict is precisely what makes the 10-year yield worth watching. When growth is weakening, the Fed wants to ease, but the long end refuses to cooperate, the market is effectively saying that something other than short-term monetary policy is driving the cost of capital.
And Then There Is Gold
This is where the argument becomes much more interesting because the relationship between Treasury yields and gold is far more complicated than the standard textbook explanation suggests. Conventional thinking says rising yields should hurt gold because gold does not produce an interest payment, making interest-bearing assets more attractive as yields rise. That relationship is strongest when rising yields represent higher real yields, particularly when the dollar is also strengthening and liquidity is tightening.
But nominal yields are not the entire story. If the 10-year yield rises because inflation expectations are rising, the impact on gold can be very different from a situation in which real yields rise because inflation is falling while nominal yields remain elevated. Gold responds to the interaction between real rates, inflation expectations, the dollar, liquidity, geopolitical risk and demand from investors and central banks. The simplistic equation of “yields up, gold down” therefore misses the actual mechanism.
And 2026 provides an important reminder of that complexity. The World Gold Council reports that central banks remain strongly interested in increasing their gold holdings, with 89% of reserve managers surveyed expecting global central-bank gold holdings to increase over the following 12 months and 45% expecting their own institutions to increase gold holdings.
Gold Has Developed Another Source of Demand
Central-bank behaviour matters because it introduces a structural buyer that does not necessarily behave like a traditional portfolio manager. A central bank purchasing gold is not simply deciding between gold and a 10-year Treasury based on which asset offers the highest yield; it can be diversifying reserves, reducing dependence on a particular currency, responding to geopolitical uncertainty or changing the composition of its national balance sheet.
The data shows that this is not merely theoretical. The World Gold Council reported that central banks bought a net 41 tonnes of gold in May 2026, with Poland and China among the largest buyers, while China extended its purchasing streak to 18 consecutive months in April. (World Gold Council)
This creates an important feedback mechanism. If long-term Treasury yields remain structurally higher while geopolitical and reserve-diversification concerns remain elevated, gold does not necessarily need collapsing bond yields to remain attractive. The metal can be responding to a different vector altogether, one involving confidence in the architecture of global reserves rather than simply the direction of U.S. interest rates.
That is why the relationship deserves to be studied rather than reduced to a single rule. Gold is not simply a trade against interest rates. It is increasingly a trade involving confidence in currencies, sovereign balance sheets, liquidity and the global financial system.
The Real Question Is What the Yield Is Saying
This brings us back to the “Golden Key” idea. The useful signal is not “the 10-year is going higher, therefore buy gold,” because that is far too simplistic and ignores the variables that determine the relationship. The real question is what is causing the yield to rise and whether gold is responding to the same underlying pressure or moving according to a different force.
If yields rise because real rates are increasing sharply while the dollar strengthens and liquidity contracts, gold could face pressure. If nominal yields rise because inflation expectations, fiscal concerns and geopolitical uncertainty are increasing while central banks continue accumulating gold, the same movement in the 10-year yield could coexist with strong demand for gold.
That distinction turns the yield chart from a simple interest-rate indicator into a vector. We are no longer asking only whether the 10-year yield is high or low. We are asking where it is moving, how quickly it is moving, what is driving that movement, and whether gold is responding proportionally or beginning to diverge.
Divergence is where the information becomes particularly interesting. If the 10-year yield breaks higher while gold refuses to weaken, the market may be telling us that something more powerful than the traditional yield relationship is supporting gold. Conversely, if yields surge and gold breaks sharply lower while the dollar strengthens, the market is signalling a very different regime.
The Market Often Reveals the Answer Before the Narrative Does
This is why bond charts deserve far more attention than they usually receive. Headlines tend to describe what has already happened, while markets continuously price what participants believe is coming next, and the difference between those two things is where much of the opportunity exists. By the time the economic data confirms the new regime, the bond market, currency market and precious-metals market may already have spent months adjusting to it.
The current structure therefore deserves monitoring rather than a simplistic prediction. The 10-year yield is around the mid-4% area, the long-term downtrend has been challenged, inflation and fiscal pressures remain important variables, and gold continues to benefit from persistent official-sector demand. (The Wall Street Journal)
The key is not to become emotionally attached to either outcome. If the yield breaks higher and gold confirms the relationship we expect, the signal strengthens; if the relationship fails, that failure is information and may reveal that the market has entered a different regime.
That is the difference between watching a chart and reading a market.
The Golden Key Is the Relationship, Not the Prediction
The most valuable lesson here is not that long-term rates are destined to rise or that gold is guaranteed to follow a particular path. It is that the relationship between bonds, yields, inflation, the dollar and gold contains information that becomes visible only when the variables are examined together.
A rising 10-year yield tells us that bond prices are under pressure. A sustained break above a major long-term trend would tell us something more important: the old interest-rate regime may no longer be functioning in the same way. If gold simultaneously refuses to behave according to its traditional relationship with yields, that divergence becomes another piece of the puzzle.
The market does not hand us a golden key by shouting the answer. It leaves clues across different markets and waits for someone to connect them. The yield is one clue, gold is another, inflation is another, the dollar is another, and central-bank behaviour is another; the edge comes from seeing the geometry connecting them before the crowd turns the relationship into an obvious headline. That is where the real signal begins.