
Spotting Trends: Unleashing the Best Stock Market Indicators
Updated June 2023
Embarking on a journey through the realm of market analysis, we delve into the historical significance and real-time functionality of older tools. Tools such as the Adult Index, the religious provocation index, and V-readings provide valuable insights into past market dynamics. However, our primary focus will be on newer tools, including the Anxiety Gauge and the Market Sentiment Indicator, which reveal investors’ prevailing bullish, bearish, and neutral readings.
While numerous other indicators, such as the ultimate indicator, multi-timeframe analysis, and the rage index, exist, our attention will be directed towards these core tools. Combining the principles of Mass Psychology and contrarian investing methodologies with these indicators, we unlock the potential for remarkable outcomes. Prepare to witness the wonders that unfold when these powerful tools converge.
The Religious Index: Predicting Violence & Immorality
Here we get an insight into how tensions between different religions and cultures are increasing worldwide. The higher the Index soars, the more violent the interactions between other faiths and cultures will be. When we combine this with the Poverty Index and Adult Index, it will give us insights into where the next potential hot zones will be. These Indices have proven to be remarkably accurate.
This index indicated well in advance that the Iraqi and Afghanistan wars would be big disasters, even when the administration was busy claiming victory and painting a rosy picture. It even predicted a new war would break out in the Middle- East before Israel attacked Hezbollah in 2006. They expected the dawn of the Arab Spring and the Chaos that would ensue in Libya. The Index went on to predict the Rising tensions between Russia and the West before the Annexation of Crimea. These are just a few of the many things these indices predicted well before the event.
Fascinating read: Stock Market Indicators: Tactical Investor’s Proprietary Tools
Another example of the Religious Index in Action
After a prolonged period, this index has finally shown signs of deceleration, although it has yet to retract. Over the past three months, its gains have been limited to a mere 12 points. Despite this, the index remains exceptionally high, indicating a potential upsurge in planned and spontaneous acts of terror, violence, and warfare. Moreover, it suggests an escalation in indirect hardships resulting from the consequences of war or repression. The situations in Zimbabwe and certain parts of North Africa are compelling examples of this phenomenon. Brace yourself for an unprecedented rise in immoral behaviour in the next five years.
Societal Shift Towards Extreme Materialism Reflected in New Highs of Adult Index
The Adult Index has continued to surge in the past three months, reaching new record highs. It has risen by 125 points, going from 1450 to 1575. These unprecedented highs signify that society is entering what we have termed the “I am willing to do whatever it takes for money or material gains zone.” This is evident in the proliferation of reality shows where individuals are willing to go to extreme lengths for a chance at fame, often compromising their values in shows like The Bachelor or The Bachelorette. The following story provides a clear illustration of this emerging trend.
Miami Beach authorities have permanently shut down a notorious “brothel bus” known for offering lap dances and drinks while cruising the streets. The bus, resembling a sleek black limousine, was impounded, and its operator was arrested during the early hours of Sunday. Passengers were charged $40 for unlimited drinks and a tour of the popular South Beach neighbourhood, which tourists and club-goers frequently visit. Undercover detectives who boarded the bus discovered a fully stocked bar and several young women who revealed G-strings filled with cash. It was reported that these individuals were offering sexual services, including oral sex, for $100.
The Rising Poverty Index and its Predictive Power
The rising Poverty Index signifies a parallel increase in poverty levels worldwide. While the index primarily focuses on the United States, its implications provide insights into the country’s future outcomes. Remarkably, the index has demonstrated an impressive track record. It predicted well in advance that the 2008 economic meltdown would not lead to widespread relief and that only those already financially secure would benefit. In other words, it forecasted a scenario where the rich would become wealthier, the poor would become poorer, and the middle class would face significant challenges.
Unveiling the Power of Anxiety Gauge
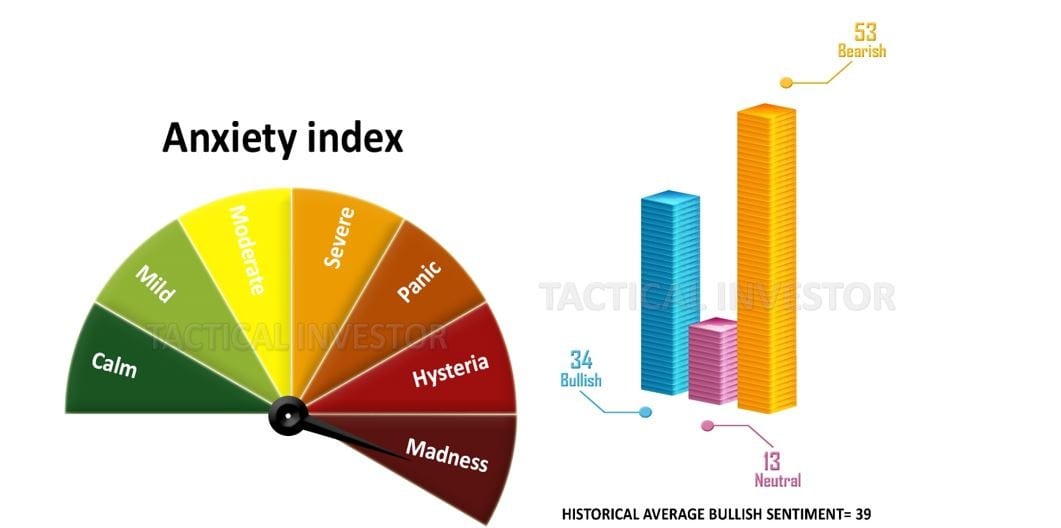
The needle on the anxiety sensitivity index is one of the most effective ways to gauge extreme euphoria or mass stress/fear within the market. Ideally, the readings should fall within the extreme range of either spectrum. By combining this data with our sentiment indicators, including the bears, the bulls, and the neutral individuals, we can identify significant turning points in the market.
Market trends often experience important shifts when bullish sentiment trades within the 50-55 range, with higher readings being more significant. High bullish readings are typically associated with market tops. The same principle applies to bearish extremes, where extreme readings often indicate market-bottoming action. A reading of 50-55 suggests that the crowd is in a state of total panic, signalling a potential buying opportunity from a long-term perspective.
One particularly noteworthy occurrence is when neutral readings surge into the 50-55 range, with higher readings being more significant. This surge indicates extreme uncertainty, as both bears and bulls are unsure of their next move, leading them to avoid the markets. It reflects a form of learned helplessness. This phenomenon was observed from 2009 until almost 2018, as the stress and shock from the housing collapse left many investors frozen in fear, causing them to stay away from the markets for extended periods.
Best Stock Market Indicators: From Newbie to Knowledgeable
One of the major errors made by inexperienced investors, and even those with substantial market exposure, is neglecting true learning and self-education. Simply consuming irrelevant news or blindly following others’ trading ideas does not foster growth. It is essential to recognize that what works for someone else may not work for you. Your unique risk tolerance, mindset, and discipline (or lack thereof) require developing a customized strategy.
While incorporating successful traders’ ideas into your trading style can be advantageous, blindly mimicking their every move will eventually lead to losses. Instead, please keep it simple and focus on the fundamentals. Novice traders should begin by identifying the market trend. Investors gain a deeper understanding of market performance and direction by analysing long-term trends and patterns. This enables them to make informed decisions rather than relying on guesswork or rumours.
When examining trends, pay close attention to the V readings depicted in the accompanying image. These readings provide valuable insights into market volatility, assisting investors in anticipating potential shifts. While the current market may be experiencing record highs, it remains crucial to monitor the trend and watch for indications of stability or decline.
Remember, success lies in the development of your personalized strategy. Dedicate time to learning, adapting, and growing, and you will be on the path to achieving your financial objectives in the market.
Originally published on June 4, 2015, this insightful analysis has undergone consistent updates and refinements. The latest update in June 2023 brings forth the most current and comprehensive insights.
FAQ on The Best Stock Market Indicators
Q: What are some of the older market analysis tools with historical significance?
A: Some older tools include the Adult Index, the religious provocation index, and V-readings, which provide insights into past market dynamics.
Q: What newer tools focus on investors’ sentiment readings?
A: The newer tools include the Anxiety Gauge and the Market Sentiment Indicator, which reveal the prevailing bullish, bearish, and neutral readings of investors in the market.
Q: Are there any other notable indicators mentioned in the analysis?
A: Yes, there are additional indicators, such as the ultimate indicator, multi-timeframe analysis, and the rage index. However, the analysis focuses primarily on the core tools mentioned.
Q: How can combining Mass Psychology and contrarian investing methodologies with these indicators benefit investors?
A: Combining these methodologies with the indicators can unlock the potential for remarkable outcomes in market analysis and decision-making.
Q: What predictive power do the Religious Index and Poverty Index hold?
A: The Religious Index accurately predicted events such as the Iraq and Afghanistan wars, the Arab Spring, and tensions between Russia and the West. The rising Poverty Index reflects the increasing wealth gap, as it forecasted the disproportionate benefits of the 2008 economic meltdown.
Q: How does the Anxiety Gauge help in market analysis?
A: The Anxiety Gauge effectively measures extreme euphoria or mass stress/fear within the market. Significant turning points in the market can be identified by combining them with sentiment indicators.
Q: What does a surge in neutral readings indicate?
A: A surge in neutral readings suggests extreme uncertainty, where both bears and bulls are unsure of their next move and tend to avoid the markets.
Q: What is the importance of developing a personalized strategy?
A: Developing a strategy tailored to your unique risk profile, mindset, and discipline is crucial. Blindly following others or relying on irrelevant news can hinder growth and lead to losses.
Q: How can investors gain a better understanding of market performance?
A: Investors can better understand market performance and make informed decisions by analysing long-term trends and patterns.
Q: What is the significance of monitoring the trend and watching for stability or decline?
A: Even during market highs, monitoring the trend and identifying signs of stability or decline is essential for making informed investment decisions.
Q: When was the analysis originally published, and when was it last updated?
A: The analysis was originally published on June 4, 2015, and the latest update was made in June 2023, incorporating the most current insights.
Unlocking Ideas: Articles That Inspire Fresh Thinking

Stock Market Forecast Next 10 Years: Feasible or Not?

Why is the US Dollar Not Backed by Gold? Unveiling its Deadly Impact

Embracing Contrarian Meaning: The Magic of Alternative Perspectives

Best Ways to Beat Inflation: Inspiring Insights from Contrarian Investors

In the Shadows of Crisis: The Stock Market Crash Recession Unveiled

The Long Game: Why Time in the Markets Beats Timing the Markets

Unveiling Falsehoods: Which of the Following Statements About Investing is False

How to Win the Stock Market Game: Cracking the Code

Which of the Following is True When the Velocity of Money Falls? Economic Slowdown

Investor Sentiment and the Cross Section of Stock Returns: Exploring the Hot Connections

Investing for Teenagers: Laying the Foundation for a Financially Stable Future

Building a Resilient Investment Strategy with 40/60 Portfolio Diversification

IBM Stock Price Forecast 2024: Examining IBM’s Strategic Vision

US Stock Market Crash History: Lessons for Earning

What Is Price to Sales Ratio?: Understanding a Key Valuation Metric
