
RSI Indicator: Start with Divergences!
Sept 10. 2026
RSI Negative Divergence: When Confidence Begins to Crack
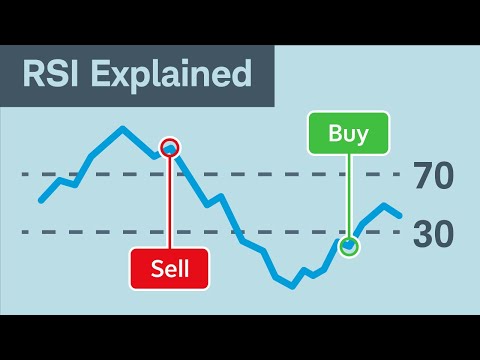
The Relative Strength Index becomes far more interesting when you stop treating it as a simple overbought or oversold gauge and start looking for divergences. A negative divergence occurs when price pushes to a new high while RSI fails to confirm that high, revealing that upward momentum is weakening even though the crowd remains confident. It does not predict an imminent collapse, but it can expose an important change beneath the surface: price is still advancing, while the force behind the advance is beginning to deteriorate.
This is where technical analysis intersects with mass psychology. Markets are driven by the interaction between price, expectations, liquidity, and human emotion, and divergences can reveal when those forces are no longer moving in harmony. When enthusiasm remains elevated while momentum weakens, the market may be entering a phase where a relatively small shift in sentiment can produce a disproportionately large reaction. The objective is therefore not to worship the RSI or treat every divergence as a trading signal. The objective is to recognize when market behaviour is changing before that change becomes obvious to the crowd.
Neuroeconomic Warfare: Understanding the Crowd
Fear and greed are not occasional disruptions in financial markets. They are persistent forces that influence how investors interpret information, assess risk, and respond to price movements, particularly when uncertainty becomes extreme. Herd mentality amplifies these reactions because investors tend to derive confidence from the behaviour of others, creating feedback loops in which rising prices generate optimism and falling prices generate fear.
That psychological feedback helps explain why markets can overshoot in both directions. During euphoric phases, investors increasingly focus on information supporting the bullish narrative, while during panics they often interpret every development as confirmation that conditions are deteriorating further.
History provides countless examples. The 1929 crash, Black Monday in 1987, the 2008 financial crisis, and the COVID collapse all demonstrated how quickly expectations can shift when confidence breaks. The specific causes were different, but the psychological sequence was remarkably familiar: confidence, uncertainty, fear, forced selling, exhaustion, and eventually stabilization.
RSI divergence belongs earlier in that sequence. A bearish divergence can warn that the confidence supporting a rally is becoming less powerful, while a bullish divergence can indicate that selling pressure is losing momentum even though prices remain weak.
The Contrarian’s Crucible: Reading RSI Divergence
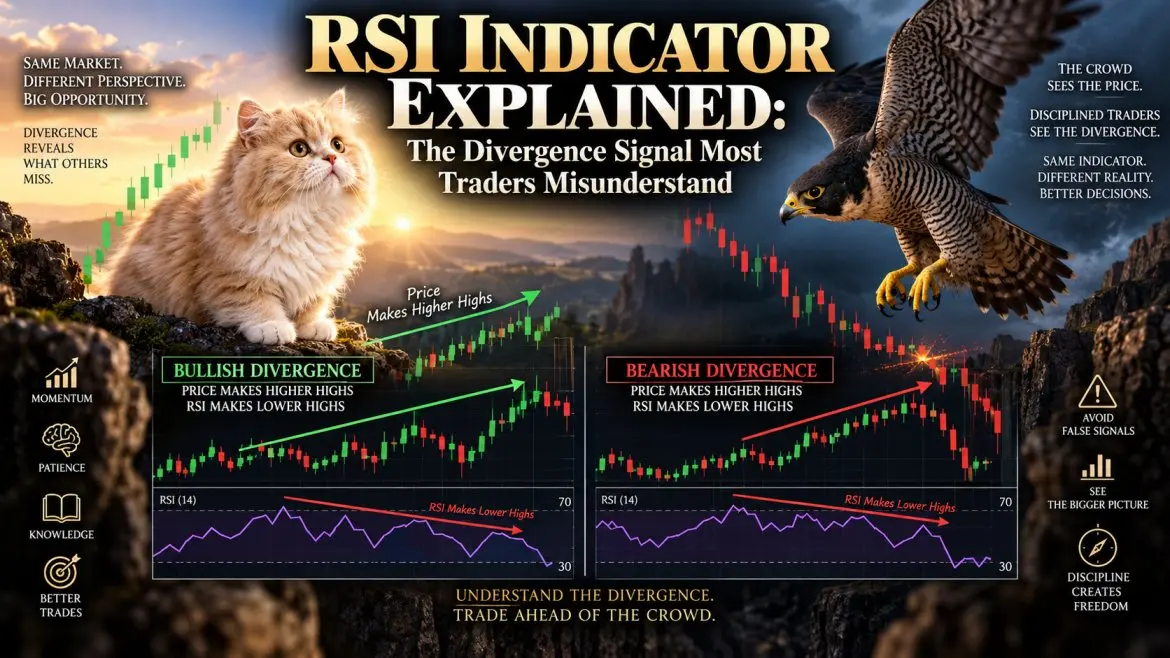
A negative divergence occurs when price establishes a higher high while RSI establishes a lower high. The market is therefore saying two different things at once: price remains strong, but momentum is no longer confirming that strength.
That distinction is important because a divergence can persist. Prices can continue rising despite weakening momentum, sometimes for considerably longer than impatient traders expect. The divergence becomes more valuable when combined with other evidence such as deteriorating breadth, weakening volume, excessive valuation, extreme sentiment, or a breakdown in important technical levels.
This is where the contrarian investor gains an advantage. Instead of asking whether RSI says “sell,” the better question is whether the market’s behaviour is becoming increasingly inconsistent with the prevailing narrative. If prices continue rising while momentum and participation deteriorate, the divergence becomes a warning that the crowd’s conviction may be stronger than the underlying buying pressure.
The reverse applies to bullish divergence. When price makes a lower low but RSI makes a higher low, selling pressure is weakening even though the crowd may still be deeply pessimistic. That does not guarantee a bottom, but when combined with capitulation, improving breadth, stabilizing fundamentals, and extreme sentiment, it can identify conditions worth investigating.
Technical Analysis Is About Behaviour, Not Certainty
Technical analysis is often misunderstood as a system for predicting exactly what happens next. Its greater value is that it provides a framework for studying what market participants are actually doing with their capital.
RSI measures momentum. MACD helps evaluate changes in momentum and trend. Moving averages provide broader trend context, while breadth and volume help determine whether price movements are being supported by widespread participation. Used together, these tools can transform an apparently chaotic market into a more interpretable picture of advancing and weakening forces.
The key is confirmation. A single RSI divergence should never be treated as proof that a market has topped, because momentum can weaken while prices continue higher. Likewise, an oversold RSI does not mean a decline has ended, because markets can remain oversold while the underlying trend continues to deteriorate. The strongest signal emerges when several independent forms of evidence begin pointing in the same direction.
Fear Alchemy: Turning Emotional Extremes Into Opportunity
The most interesting application of technical analysis occurs when it intersects with mass psychology. Extreme fear can force investors to sell regardless of valuation, while extreme optimism can encourage them to pay almost any price for an attractive narrative.
This is where disciplined investors can exploit asymmetry. During periods of severe volatility, option premiums can become unusually expensive because the market is pricing in greater uncertainty, creating opportunities for investors who understand the underlying asset and are prepared to own it at an acceptable price.
Selling cash-secured puts is one example. Instead of simply placing a limit order and waiting, an investor can potentially collect premium while agreeing to buy the underlying stock at a predetermined strike if assignment occurs. In a genuine panic, that combination can provide an attractive entry mechanism for an investor who already wants to own the asset.
The important distinction is that the strategy begins with the underlying asset, not the option. Selling puts on a stock you would never want to own simply because volatility is high is speculation disguised as discipline.
Discipline and Risk Management
Contrarian investing does not mean automatically buying weakness or fighting every market decline. It means understanding the difference between temporary emotional distortion and genuine deterioration, then allocating capital accordingly.
Position sizing matters because even a correct thesis can become expensive if the timing is wrong. Staged entries provide flexibility, liquidity creates staying power, and diversification prevents one incorrect assessment from destroying the broader portfolio.
Emotional control is equally important. The investor who buys because everyone is euphoric and sells because everyone is terrified is effectively outsourcing his decisions to the crowd. The disciplined investor does the opposite by establishing conditions for action before emotion reaches its maximum intensity.
Breaking Free From the Herd
The real purpose of studying RSI divergence is not to create another mechanical trading system. It is to develop a better understanding of how price and psychology interact, because markets frequently reveal their vulnerabilities before the crowd recognizes them.
A negative divergence tells you that rising prices are no longer being confirmed by rising momentum. A positive divergence tells you that falling prices are no longer being confirmed by increasing downside momentum. Neither provides certainty, but both can reveal a change in the underlying market vector.
That distinction is crucial. You are not trying to predict every fluctuation; you are trying to identify when the forces driving the market are changing and then determine whether that change creates an actionable opportunity.
Conclusion: Start With the Divergence
The RSI indicator becomes far more useful when you stop asking whether it is simply overbought or oversold and start asking whether momentum confirms what price is doing. Divergences can expose weakening conviction, emerging exhaustion, and potential changes in the market’s underlying vector before those changes become obvious.
The real edge comes from combining that information with sentiment, liquidity, valuation, breadth, and mass psychology. When the crowd is euphoric and momentum begins to deteriorate, caution becomes rational; when fear dominates and downside momentum begins to exhaust itself, opportunity deserves closer examination.
Start with divergences, but never stop there. The indicator provides a clue, psychology explains the behaviour, and disciplined analysis determines whether that clue is worth acting upon. The investor’s advantage does not come from predicting the future with certainty, but from recognizing when the crowd has pushed price and psychology to an extreme and being prepared when the market’s vector finally changes.