
Dow Jones Global Index: A Timeless Symphony of Global Markets
Apr 19, 2023
The Dow Jones Global Index is an exceptional financial instrument meticulously crafted to represent the worldwide stock market landscape comprehensively. Encompassing 150 elite companies handpicked by esteemed Dow Jones editors, the index highlights organizations with a rich legacy of success and a strong appeal among discerning investors.
Employing an equal-weighted approach, the Global Dow ensures an unbiased and sophisticated snapshot of the global economy. It casts a discerning eye over developed and burgeoning markets, striving to encompass 95% of global market capitalization. This ambitious goal underscores the index’s dedication to providing a well-rounded, insightful perspective on the intricacies of the international financial stage.
The Market’s Melodic Movements
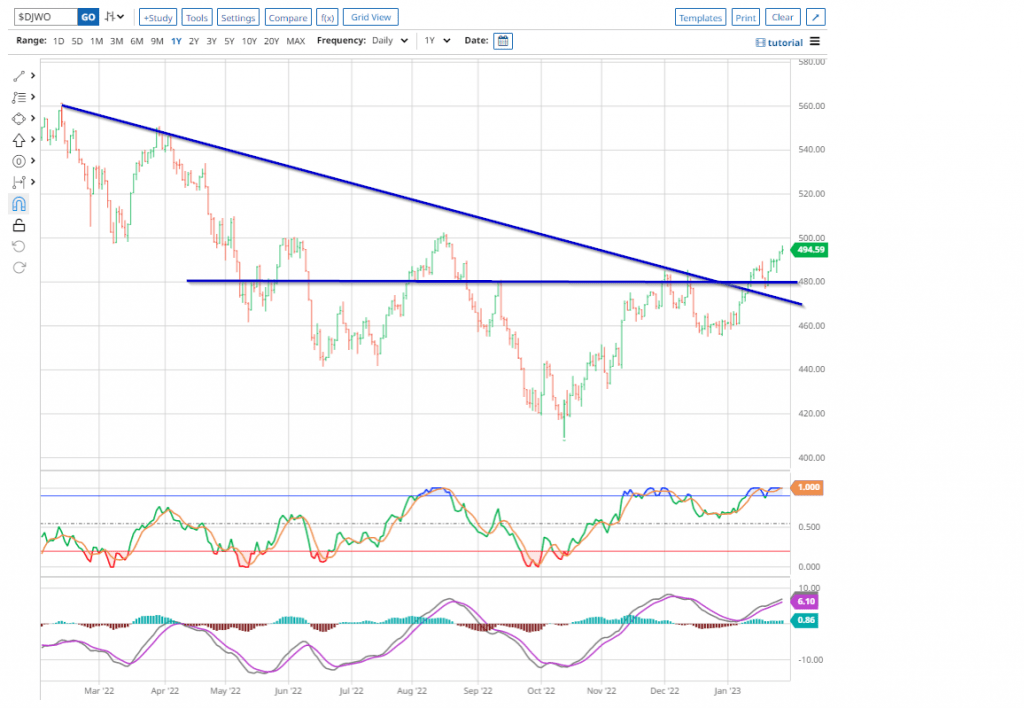
So, what is the Dow Jones Global Index stating now? The upward breakout in the chart below is a favourable sign, pointing towards the possibility of a multi-month bottom. It is essential to have support from other indices, as the pattern should be seen in the charts spanning 24 and 36 months. Further confirmation is close at hand. The downtrend line in the 2-year chart of the Dow Jones Global Index is dangerously close to being broken to the upside, further reinforcing the bullish outlook. Such patterns, 9 out of 10 times, are early harbingers of the Market putting in a multi-month bottom.
Harmonious Sentiment Divergences
Long-term chart of the Dow Jones Global Index:
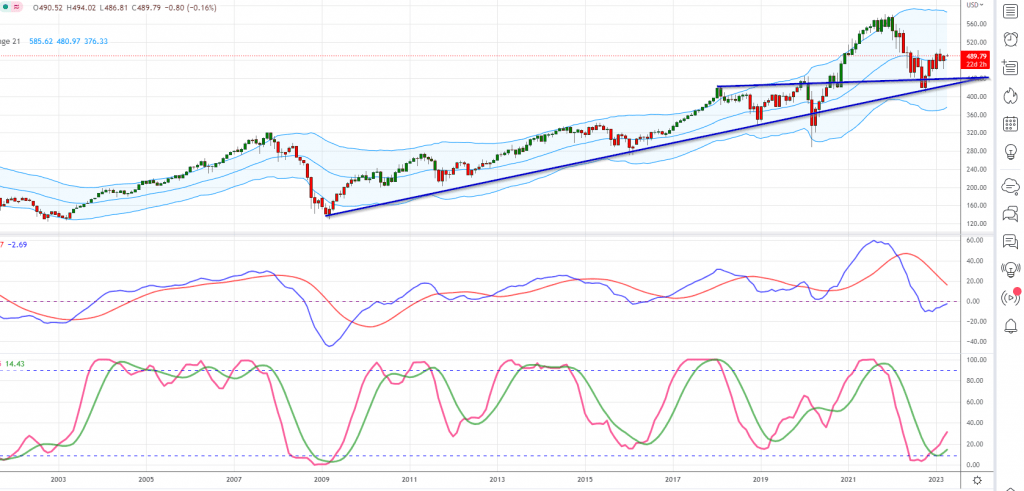
As long as it does not close below 420 on a monthly basis, the outlook will remain neutral with a bullish bias. In contrast, a monthly close at or above 510 will signal a test of 560 is in the works.
On the sentiment front, there are some divergences:
Bullish sentiment has traded below its historical average for over a year, even when the Dow has mounted rallies exceeding 2000 plus points. Highly unusual action.
Bearish sentiment has not spiked to the 63-65 range. If fear were running high, it would have remained at this level for at least two weeks in a row.
More importantly, if you look at the sentiment data, you will notice that individuals are jumping from the bearish to bullish camps. We have not seen one massive spike in neutral readings. Hence while the masses are scared, they are not in panic mode. Too many individuals think they can jump from the bullish to bearish camp and game the market. One of the following needs to occur:
For a market bottom to be considered tradable and sustained for six months or more, bullish sentiment readings should decline to the 10-12 range or for bearish sentiment readings to increase to above 63. The most favourable scenario is when neutral sentiment rises above 55, as a neutral reading at or above 55 strongly correlates with establishing a market trough, indicating that the bulls and bears have been crushed/neutralized.
The Finale: Projections and Possibilities
In conclusion, the Dow Jones Global Index breaking its 12-month downward trend line is a positive signal and appears to be close to surpassing its 24-month downward trend line. The Dow Jones Industrials has shown resilience, recovering most of its recent losses. However, there is a short-term challenge ahead at 34,150, as it must close above this level on a weekly basis. If this level is not reached, it may indicate a potential test of the December and possibly September lows. Additionally, the S&P 500 has also traded above its 12-month downward trend line, further highlighting the positive developments in the Market.
We expect that there will be one final corrective wave, possibly accompanied by a selling climax. A higher low indicates one of the indices may show a positive divergence. Until then, we will continue to strive for new opportunities to invest in crucial stocks at favourable prices.
A wide range of market price movements creates ideal conditions for technical analysis. By reviewing historical charts, one can observe the effectiveness of technical analysis during such periods, and the results are even more remarkable when paired with the influence of mass psychology.
A Dance of Discernment
The Dow Jones Global Index elegantly weaves the threads of the past and present, creating a rich tapestry that captures the essence of global commerce. This symphony of market movements and sentiment divergences guides the astute investor, echoing the wisdom of the ages with the keen insight of contemporary financial analysis.
As we navigate the ever-shifting landscape of the global economy, let us embrace the harmonious blend of Montaigne’s timeless style and modern financial acumen. Together, they form a masterful composition that enlightens our understanding of the Dow Jones Global Index and its pivotal role in the grand symphony of global markets.
Conclusion
The Dow Jones Global Index is a comprehensive financial instrument providing a well-rounded global economy perspective. Its equal-weighted approach ensures an unbiased snapshot of the worldwide stock market landscape, encompassing developed and burgeoning markets. The index’s dedication to providing a sophisticated perspective on the international financial stage is evident in its inclusion of 150 elite companies handpicked by esteemed Dow Jones editors.
The Dow Jones Global Index’s upward breakout is a favourable sign, pointing towards the possibility of a multi-month bottom. The bullish outlook is further reinforced by the downtrend line in the 2-year chart of the Dow Jones Global Index, which is dangerously close to being broken to the upside. The sentiment data shows that individuals are jumping from the bearish to bullish camps, indicating that the masses are scared but not in panic mode.
The Dow Jones Global Index breaking its 12-month downward trend line is a positive signal. We expect that there will be one final corrective wave, possibly accompanied by a selling climax. The Dow Jones Global Index elegantly weaves the threads of the past and present, creating a rich tapestry that captures the essence of global commerce. As we navigate the ever-shifting landscape of the global economy, let us embrace the harmonious blend of Montaigne’s timeless style and modern financial acumen.
Insights on the Ever-Evolving Stock Market
As we conclude this article, let’s delve into some compelling investment concepts that warrant attention.
On a separate but equally vital note, cultivating a profound understanding of technical analysis is paramount. It equips individuals with the power to discern pivotal market turning points and adeptly navigate the intricacies of crowd behaviour, herd mentality, and the pervasive bandwagon effect.
These psychological phenomena significantly influence investment outcomes, often yielding unfavourable consequences. By seamlessly integrating the principles of Mass Psychology into your investment approach and embracing the art of contrarian investing, you effectively mitigate the risks of blindly following the herd.
FAQs
| Question | Answer |
|---|---|
| What is the Dow Jones Global Index? | The Dow Jones Global Index is a comprehensive financial instrument providing a well-rounded global economy perspective. Its equal-weighted approach ensures an unbiased snapshot of the worldwide stock market landscape, encompassing developed and burgeoning markets. |
| What is the significance of the Dow Jones Global Index’s upward breakout? | The upward breakout in the Dow Jones Global Index is a favourable sign, pointing towards the possibility of a multi-month bottom. The bullish outlook is further reinforced by the downtrend line in the 2-year chart of the Dow Jones Global Index, which is dangerously close to being broken to the upside. |
| What does the sentiment data show about the Dow Jones Global Index? | The sentiment data shows that individuals are jumping from the bearish to bullish camps, indicating that the masses are scared but not in panic mode. |
| What can investors expect in the future for the Dow Jones Global Index? | We expect that there will be one final corrective wave, possibly accompanied by a selling climax. The Dow Jones Global Index breaking its 12-month downward trend line is a positive signal, and we expect to see continued positive developments in the Market. |
| FAQ: | |
| What is the Dow Jones Global Index’s approach to selecting companies? | The Dow Jones Global Index employs an equal-weighted approach, ensuring an unbiased and sophisticated snapshot of the global economy. It encompasses a diverse array of 150 elite companies handpicked by esteemed Dow Jones editors, highlighting organizations with a rich legacy of success and a strong appeal among discerning investors. |
Articles That Inspire: Our Collection of Compelling Reads

Losing Money in the Market: Strategies to Minimize the Risk

Why Is Inflation Bad for the Economy? Demystifying the Menace
The Dow Jones Industrial Average Expected To Trend Higher

Stock Market Blues? The easy trade is over

Semiconductor Industry News: Key Technical Developments

Unveiling the 1929 Crash Chart: Decoding Market Turbulence

The Dynamics of Bull & Bear Markets: Mastering Trend Analysis

Negative Thinking: How It Influences The Masses

The Limits of Herd Behavior in Markets

Lagging Economic Indicator: Understanding Its Significance

Semiconductor Outlook: Trends & Future Expectations

Trading Journal: The invaluable tool for traders

Stock market experts know Nothing

Best Investment Ideas; Focus on the strategy first