
Income inequality statistics: Disturbing trends
Economic inequality in the United States has been a persistent and growing issue for decades. Despite being one of the wealthiest nations in the world, a significant portion of the population continues to struggle with poverty and lack of access to basic necessities. In this article, we will delve into the facts and figures surrounding economic inequality in the United States, and explore the causes and consequences of this societal issue.
Income Inequality: The Widening Gap between the Rich and the Poor
One of the most striking facts about economic inequality in the United States is the widening gap between the rich and the poor. According to data from the U.S. Census Bureau, the top 1% of households in the country now hold a larger share of overall income than at any point since the 1920s. This means that a tiny fraction of the population controls a disproportionately large share of the nation’s wealth.
This trend is illustrated in the following diagram, which shows the change in income share for different income groups from 1967 to 2018:
As the diagram shows, the bottom 50% of households have seen their share of overall income decline, while the top 1% has seen their share increase dramatically.
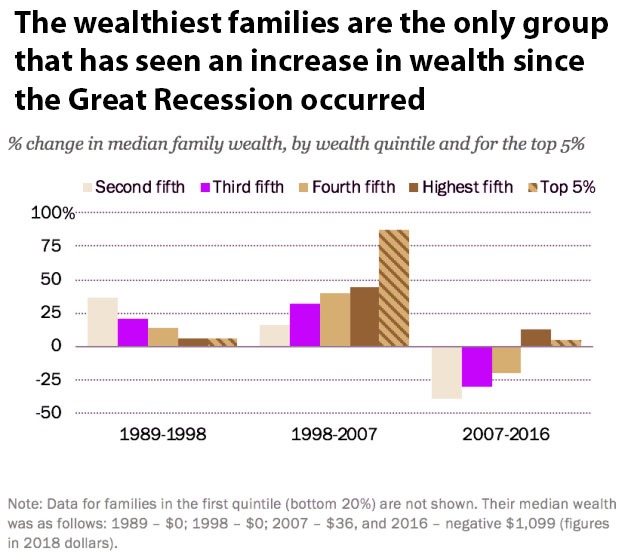
Wealth Inequality: The Concentration of Assets among the Rich
Income inequality is just one aspect of economic inequality in the United States. Another important factor is wealth inequality or the concentration of assets among the rich. According to data from the Federal Reserve, the top 1% of households in the country own more than 40% of the nation’s wealth. This means that a tiny fraction of the population controls a vast majority of the country’s assets, including stocks, bonds, and real estate.
This trend is illustrated in the following diagram, which shows the change in wealth share for different wealth groups from 1970 to 2018:
As the diagram shows, the bottom 90% of households have seen their share of overall wealth decline, while the top 1% has seen their share increase dramatically.
Causes of Economic Inequality
The causes of economic inequality in the United States are complex and multifaceted. Some experts point to structural factors such as globalization and automation, which have led to the decline of well-paying manufacturing jobs and the rise of low-wage service jobs. Others argue that government policies, such as tax cuts for the wealthy and cuts to social welfare programs, have exacerbated the problem.
Consequences of Economic Inequality
Economic inequality can have a wide range of negative consequences for individuals, communities, and society as a whole. Some experts argue that inequality can lead to social unrest and political polarization, as well as an erosion of trust in government and institutions. Others point to the relationship between inequality and poor health outcomes, such as higher rates of obesity, heart disease, and mental illness.
In conclusion, economic inequality in the United States is a complex and pressing issue that demands attention from policymakers, business leaders, and individuals alike. By understanding the facts and figures surrounding inequality, as well as its causes and consequences, we can begin to develop solutions that promote greater economic fairness and opportunity for all.
Other Articles of Interest
Fed Head Will Shock Markets; Expect Monstrous rally
In The Midst of Chaos There is Opportunity
Central Bankers World Wide embrace race to the Bottom
Currency Wars & Negative Rates Equate To Next Global Crisis
Control Group Psychology: Stock Crash of 2016 Equates To Opportunity
Erratic Behaviour Meaning:Dow likely to test 2015 lows
Little Bird’s Trading Plan To Wealth
The Smart Investor IS buying While The Dumb Money selling
Working Poor: Masses struggle while Fed Bails Out Banksters