


Unveiling the Illusion: Death Cross and the Quest for Market Advantage
Dec 18, 2024
Introduction:
In investing, the allure of simplicity is undeniable. Investors are often drawn to easy-to-understand signals, believing they provide an edge in navigating the market’s intricate dynamics. One such signal that has captured the attention of many is the “Death Cross.” This technical indicator, characterized by the 50-day moving average of a security dipping below its 200-day moving average, is often seen as a harbinger of doom. But does it genuinely signify an impending catastrophe, or is it an illusion without tangible value? Let’s dive deeper into this intriguing topic.
Investing is a nuanced field where simple signals rarely provide the whole picture. It’s essential to approach these indicators critically, understand their limitations, and use them as part of a broader, more comprehensive investment strategy.
The Illusion of Simplicity – What is a ‘Hive Mind’?
The concept of a ‘hive mind’ originates from the behaviour of bees, which collectively make decisions to ensure the hive’s survival. In humans, it refers to a collective consciousness where individuals think and act similarly, often preceding personal judgment in favour of group consensus. This phenomenon is evident in financial markets, where the collective behaviour of investors frequently drives market trends, creating illusions of simplicity. Investors believe that following the crowd and using the same tools will give them an edge, but they often fall into the ‘hive mind’ trap.
For example, during the dot-com boom of the late 90s, investors were swept up in the excitement of a new technological era. They heavily invested in internet-based companies, even those without solid business models or profits. This collective behaviour led to an inflated market bubble that eventually burst, causing significant financial losses (Kagan, 2021). These investors were part of the herd and believed they were outwitting, illustrating the dangers of the ‘hive mind’ mentality in investing.
The Rise of the ‘Death Cross’
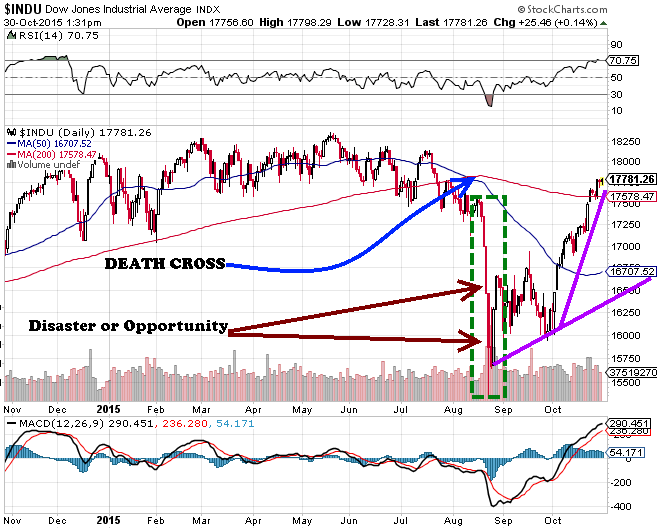
The ‘Death Cross’ is a stock or index chart pattern that occurs when the 50-day moving average dips below the 200-day moving average. Many see this crossover as a bearish signal, indicating a potential long-term downtrend. The ‘Death Cross’ has preceded severe bear markets, including those of 1929, 1938, 1974, and 2008 (Carlson, 2020). However, it’s important to note the sample selection bias, as there have been instances where a ‘Death Cross’ was followed by only a market correction.
For example, a ‘Death Cross’ occurred during the dot-com bubble in the late 1990s. Still, the market experienced a correction rather than a catastrophic crash, eventually leading to economic growth (Kagan, 2021). This demonstrates that the ‘Death Cross’ is not a foolproof indicator of a market downturn but rather a signal of a shift in short-term market sentiment.
In crypto trading, the ‘Death Cross’ holds similar significance, signalling growing weakness in an asset’s price and increasing selling pressure. However, if the downtrend is not sustained, it could be a false signal, indicating short-lived momentum and a potential price rebound (Reiff, 2021).
The ‘Death Cross’ is a technical indicator that has gained prominence due to its historical correlation with market downturns. However, like all indicators, it should be used alongside other tools and analyses to make sound investment decisions. As John Bollinger, the creator of Bollinger Bands, states, “No single indicator is ever going to be perfect. The best we can hope for is to use them in conjunction with other tools to help us make better-informed decisions” (Bollinger, 2001).
The Reality Behind the ‘Death Cross’
The ‘Death Cross’ and ‘Hindenburg Omen’ are based on moving averages, but their simplicity limits their value in predicting market trends. The ‘Hindenburg Omen’ is triggered when new 52-week highs and lows co-occur, which is seen as a sign of instability. However, it has been criticized for its lack of accuracy. Similarly, the ‘Death Cross’, a bearish signal when the 50-day moving average crosses below the 200-day, is a lagging indicator and not always reliable. These indicators are part of the ‘hive mind’ in financial markets, and when many investors react to them, it can exacerbate fluctuations.
The Broken Clock Phenomenon
The ‘Death Cross’ is like a broken clock right twice daily. When it emerged earlier this year, alarmists proclaimed an impending disaster. The market dipped briefly but soon bounced back. This underscores the importance of not relying on a single indicator. Successful investing requires a balanced, informed approach that considers many factors. The ‘Death Cross’ and alarmist reactions illustrate the broken clock phenomenon, reminding us that there are no guarantees in the complex world of financial markets.
A Perspective Shift – From Catastrophe to Opportunity
The ‘Death Cross’ can signal hidden opportunities. A successful trader, Jesse Livermore, said, “The market is designed to fool most people, most of the time.” Instead of succumbing to fear, astute investors can reassess their strategies. A ‘Death Cross’ might indicate overvalued securities, providing a chance to sell high or signal a market correction, presenting an opportunity to buy low. The key is to separate myth from reality and analyze signals in the context of broader market trends, economic indicators, and company fundamentals. The ‘Death Cross’ is not necessarily a harbinger of disaster but can signal opportunities for those willing to look beyond the hype.
We explore this topic historically for two crucial reasons. History teaches us to avoid repeating mistakes and provides real-time insights from past occurrences. Studying history gives us valuable insights into how we’ve handled similar situations, informing our understanding today.

Don’t Fear the Death Cross: A Caution for Investors
While often seen as a bearish signal, the “Death Cross” pattern does not necessarily indicate imminent danger or cause for fear. Succumbing to fear can lead to paralysis and potentially missed opportunities. Shorting the markets based on the “Death Cross” can be challenging, as markets can reverse course rapidly.
For example, if one shortens the Dow based on the “Death Cross” pattern, the results might be less than ideal. In a study of 22 developed markets from 1970 to 2019, researchers found that the “Death Cross” had a success rate of only 47.8% in predicting future market downturns (Giot & Petitjean, 2011). Additionally, the average return following a “Death Cross” was positive 51.5%, with an average gain of 2.8% (Giot & Petitjean, 2011).
Instead of focusing on shorting, investors might be better served by compiling a list of stocks to buy. Historically, markets tend to trend upward over time. Between 1950 and 2019, the S&P 500 experienced an average annual return of 11.1% (Maverick, 2021). Moreover, a study by Fidelity Investments found that staying invested in the market over the long term, regardless of market conditions, yielded better results than trying to time the market (Fidelity Investments, 2021).
Some investors view the “Death Cross” as a buying opportunity, especially when most market participants are pessimistic. Baron Rothschild, an 18th-century British nobleman and investor, famously said, “The time to buy is when there’s blood in the streets” (Schnell, 2020). This contrarian approach suggests that opportunities often arise when others are fearful.
At Tactical Investor, we view the Death Cross as a buying opportunity. It’s a moment to uncork a bottle of champagne and celebrate, even when the majority is chanting doom for the markets. It’s essential to grasp that disaster often conceals an opportunity, and the majority rarely finds themselves on the right side of the markets for any extended period. So, rejoice when panic abounds, and be cautious when the masses are exuberant.

Navigating the Death Cross: COVID Crash Update
In financial markets, it’s understood that market crashes are an inevitability. Equally particular, though often overlooked, is the prospect of a significant recovery. This recovery phase not only mends the wounds inflicted by the crash but propels the market to new heights. The catch is that most people tend to fixate on the downward trends, believing it’s not the right time to buy or that this time is somehow different, a perspective laden with misconceptions.
When markets eventually mount a triumphant rally to new record highs, these same individuals, much like bewildered penguins, will look back in astonishment at their hesitance. Unfortunately, they’ll inevitably make the same vows again, reacting similarly, inadvertently embodying the essence of insanity—repeating the same actions while vowing never to do so.
So, as we delve into the intricacies of the Death Cross and assess the stock market’s current status in April 2020, let’s remember that market dynamics are multifaceted, and a broader perspective can help us navigate the turbulent waters of financial markets.
Amidst the hysteria of the coronavirus pandemic, a lifetime buying opportunity emerges. It’s crucial not to succumb to fear but, instead, to concentrate on the opportunities it presents.
Conclusion: Navigating the Death Cross: Opportunities Amidst Chaos
As we conclude our exploration of the ‘Death Cross’ and its impact on market dynamics, a striking realisation emerges. Those who can recognize the opportunities hidden within the chaos play a crucial role in the evolution of financial markets.
History reveals a captivating paradox: while the masses may succumb to market hysteria, astute observers discern the opportunities lurking in the turbulence. Like the ebb and flow of civilization, financial markets have their rhythm, which shrewd investors can navigate.
Examples from the past, such as the COVID-19 crash in 2020, demonstrate that significant recoveries often follow market crashes. The S&P 500 plummeted by 34% in just 33 days, but by August 2020, it had already rebounded to new highs (NerdWallet, 2023). Investors who panic-sold during the crash missed out on the subsequent recovery.
To thrive amidst the chaos, it is essential to maintain a balanced perspective and avoid making emotional decisions based on short-term volatility. Financial experts recommend maintaining a well-diversified portfolio, having an emergency fund, and regularly rebalancing investments (NerdWallet, 2023). Market declines can also present opportunities, such as executing Roth conversions to take advantage of depreciated assets and potential tax-free growth (NerdWallet, 2023).
It’s now up to you to decide: does the Death Cross signify impending catastrophe or hidden opportunities? The answer may lie in your perspective and ability to separate myth from reality in the complex world of financial markets. Remember, the market isn’t a beast to be feared but a puzzle to be solved.
A hallucination is a fact, not an error; what is erroneous is a judgment based upon it.
Bertrand Russell
Exploring Similar Intriguing Stories


People who cannot recognise a palpable absurdity are very much in the way of civilisation.
Agnes Repplier
