
Introduction: A Provocative Query That Defies Conventional Trading Beliefs
Jan 18, 2025
Intro: The Sublime Craft of Turning Fear Into Fortune
Have you ever stood on the battlefield of the market, watching prices crumble under the weight of hysteria while a quiet few moves with the conviction of generals, amassing assets as if they’ve read tomorrow’s headlines? The spectacle of chaos—where fear blinds the herd, and opportunity teases the bold—is an enduring tale. Yet, behind every legendary comeback lies not luck but insight. Insight born of patterns, logic, and a touch of cunning: the art of identifying bullish divergence.
Let’s not sugarcoat it. Most traders are puppets pulled by the strings of emotion. They see collapsing prices and hear the drumbeat of doom in every headline. But for those with disciplined eyes, a bearish frenzy often whispers its own contradictions. A stock tumbles to fresh lows, yet momentum indicators—those subtle oracles of technical analysis—begin to diverge, showing strength where despair reigns. This is no ordinary signal; it is the market’s sly wink, a quiet admission that the crowd may have overplayed its hand.
Echoes of History: The Crash, the Carnage, the Opportunity
The tech wreck of the early 2000s: investors, blinded by promises of digital utopia, threw themselves into the dot-com bonfire. When the bubble burst, panic became gospel. But amidst the ashes, certain minds noticed something curious. While stock prices plunged to unimaginable depths, indicators like the RSI and MACD hinted at slowing momentum. A divergence—a clue. For those who acted, who saw value in the wreckage and dared to buy, the rewards were staggering when recovery roared back like a lion from its slumber.
2008? A different crisis, same human folly. Major banks were shredded by fear, their stock prices collapsing under the weight of systemic dread. Yet, those who followed the breadcrumbs of bullish divergence saw the tide beginning to turn. Indicators nudged higher even as prices hit fresh lows. It wasn’t certainty, but it was enough—a chance to outmaneuver the paralyzed masses.
What unites these moments is not just technical acumen but an understanding of human psychology. Fear amplifies stupidity; greed multiplies errors. The masses sell because others sell, an endless echo chamber of irrationality. But the truly cunning, those who see divergence, are not just chart readers—they are psychologists of the highest order, exploiting the gap between panic and reality.
The Subtle Tells: Cracks in the Facade of Fear
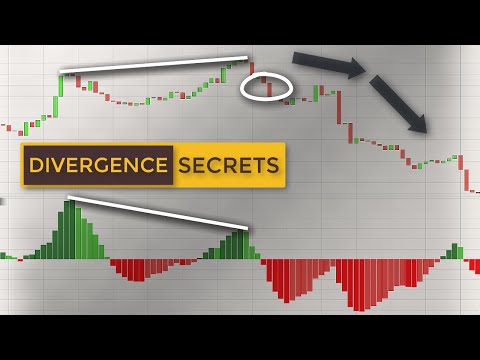
Bullish divergence is an elegant contradiction. It arises when an asset’s price sinks to new lows, but a momentum indicator—RSI, MACD, or stochastic—refuses to follow suit. The divergence is a quiet mutiny, a whisper that the sellers are tiring, even if the battle appears lost.
Picture this: a once high-flying tech stock crashes from £100 to £60. Panic reigns. Analysts spit doom from every angle. But beneath the surface, the RSI refuses to sink lower, marking a shallower dip. To the untrained eye, it’s noise; to the strategist, it’s the beginning of a potential reversal. It’s as if the market, drunk on fear, starts to sober up, and those who listen carefully prepare for the morning after.
Charts are not just lines—they are the aggregate of human behavior distilled into pure form. When bullish divergence appears, it reveals a fracture in the psychology of the market. Institutions might quietly buy, while retail panic-sells. Though not yet visible, the divergence signals that the tide may already be turning.
The Dance of Finesse: Divergence and Patience
But let’s be clear: bullish divergence is no magical incantation. It’s not an immediate reversal but a battle cry—a chance to move before the herd realizes what’s happening. Sometimes, the market grinds lower, testing the patience of even the most disciplined traders. Multiple divergences may emerge before the final reversal, each a tempting trap for the hasty and undisciplined.
Here lies the finesse: understanding that divergence is not a promise but a probability. It’s a tool for those who respect the market’s nuance and know when to strike and wait. The cunning investor wields divergence as a scalpel, cutting through fear to find opportunity, while others swing their emotions like clubs, missing the subtle cues entirely.
A Surprising Clue in Chart Patterns
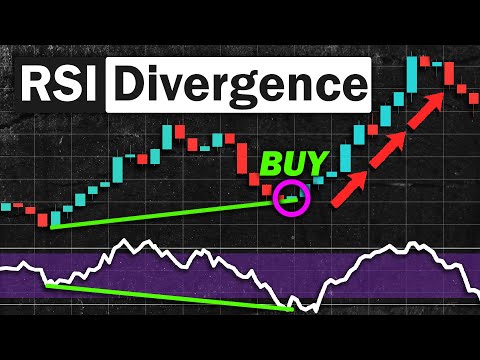
Bullish divergence refers to a situation where an asset’s price moves to a new low, yet a selected momentum indicator fails to match that new low and instead starts to march higher. In other words, the chart sends mixed signals: the price suggests one thing, while the technical indicators suggest another. This difference carries considerable weight for many traders because price alone can be deceptive if fear weighs heavily on the market. When a momentum measure such as the RSI creates a higher low even as the asset slumps, buyers are gradually stepping in, slowing the ferocity of the downtrend.
Picture a scenario with a popular tech stock battered by profit-taking. The stock price plunges from £100 to £70, meanders a bit, then plunges once more to £60. Suppose the RSI, which had reached 20 on that first leg down, now only falls to 25. The core of bullish divergence is the RSI’s shallower low, even with the price heading to a deeper low. It hints that sellers are running out of steam, which might open the door for opportunistic traders to dip their toes in—though caution remains vital since patterns can fail.
This subtle difference between price and indicators resonates in part because charts capture the actions of real participants in real-time. While a fundamental analysis approach might say the stock is strong or weak based on earnings, the chart reveals shifts in supply and demand that can occur well before headlines confirm them. If, for example, large funds sense that valuations are finally attractive, their gradual buying can start to push momentum indicators higher, even as occasional panic selling still presses the price to fresh lows. The next thing you know, the stock stabilises and rebounds more strongly than the doubters anticipated.
Interestingly, the presence of bullish divergence does not guarantee an immediate reversal. Sometimes, the market can grind lower still, creating multiple points of divergence before it truly turns around. Yet the pattern remains a widely watched signal among traders, and for good reason: it often provides an early glimpse of potential shifts in sentiment, hinting that fear may be overstaying its welcome. While novices might chalk up a new low in price to unending gloom, seasoned observers watch the indicators for any glimmer of a rebound. By doing so, they can brace themselves for the possibility of a rally, sometimes getting positioned ahead of those who rely solely on price-based judgments.
Harnessing Mass Psychology and Behavioural Finance
The raw mechanics of bullish divergence are relatively straightforward, but the driving forces lie deep in group behaviour and individual biases. When markets sink, panic feeds on itself. Traders see red on their screens and assume that means more trouble ahead. News outlets reinforce the gloom, broadcasting dire warnings 24/7. This is precisely where the collective mind can cause prices to overshoot on the downside, leaving bargains for anyone able to keep emotions in check.
Mass psychology shows how quickly a crowd can pivot from euphoria to despair. In boom times—such as before the dot-com crash or the 2008 meltdown—optimism bloats valuations, with the market piling into trendy sectors. When the bubble bursts, that same crowd scrambles to exit, causing disproportionate drops in price. Behavioural finance highlights biases like confirmation bias (where people seek data that validates their current view) and loss aversion (where the pain of losing is felt more keenly than the pleasure of gaining). Combined, these can exacerbate market swings. Investors cling to initial beliefs too long when the market rises, then flee in unison once panic sets in.
Bullish divergence registers these subtle changes in market mood, hinting that despite the wave of negativity, some participants have quietly moved from selling to buying. This often occurs near peak fear, when even casual observers can see that trader sentiment is bleak. The true question is whether the gloom has gone far enough to warrant a contrarian trade. That’s where behavioural finance can be so helpful. Knowing how crowds behave, a shrewd investor realises that capitulation usually brings some of the best trading opportunities, provided one can spot early signs of positive change in market momentum.
While it might be tempting to dismiss mass anxiety as irrational, the fear that grips people during crashes is rooted in real financial damage. As portfolios shrink, individuals question their decisions, and self-preservation takes over. Yet ironically, it is at these moments that bullish divergence can offer early clues that the storm might be passing. Not everyone will believe it, of course. Some remain too consumed by dread to notice or trust such signals, but those who study these patterns can prepare to buy at lower valuations, capturing the recovery that often follows.
Timing Trades with Bullish Divergence
One of the most attractive features of bullish divergence is how it provides a method for planning entries and exits. Instead of blindly guessing when a crash might end or a correction might deepen, traders track reliable technical indicators—such as the RSI, MACD, or Stochastic Oscillator—for telltale signs of divergence. Once identified, they can double-check other factors (like volume patterns or fundamental data) to decide if it is a promising moment to step in.
Consider a hedge-fund manager during the 2008 crisis. Fear reigned supreme, banks appeared vulnerable, and major stock indices crumbled each day. Still, from a purely chart-based standpoint, large-cap stocks began showing repeated bullish divergence on RSI while shares continued testing lower levels. The manager examined daily volume, noticing it began to fade on down days while spiking on modest upswings—an indication that buyers were gradually becoming bolder. Encouraged by this combination, the manager started accumulating positions. Though the broader market continued to whipsaw, these decisions paid off handsomely when the recovery finally took hold.
That experience reflects how an example of bullish divergence can function in real trading. The manager did not rely on guesswork; he had a framework that integrated signals of shifting sentiment. By the time mainstream media acknowledged signs of stabilisation, prices had already moved up from their lows. Another advantage is that if the market defies the divergence and keeps falling, traders can exit positions swiftly—usually at fairly small losses—because they have tied their trades to a clear technical level. A bullish divergence can be a cost-efficient way to test for a possible bottom, providing a rung to grab onto in a falling market.
Moreover, well-timed purchases guided by such charts can be especially powerful when combined with fundamental analysis. A company battered by recession fears but still delivering strong business results might display bullish divergence on its chart, revealing buyers are testing the waters. Behind the scenes, This synergy between chart signals and rational business valuation often leads to positions that survive market turbulence. AWhengood news finally arrives: share prices can shoot higher, rewarding those brave enough to act.
The Emotional Roller Coaster: Euphoria and Fear
Human emotion tugs violently at our decisions. When markets roar ahead, everyday investors yearn to join the party, convinced that missing out would be worse than any potential loss. During the dot-com mania, people remortgaged homes to invest in questionable internet start-ups. The idea of unstoppable riches drowned out warnings from cooler heads. Then, once the bubble burst, those who had bought into peak euphoria felt the crushing blow of steep declines. They ran for the exits at a time when prices were arguably oversold, effectively locking in huge losses.
Flip that script to times of widespread panic: 2008 saw share prices spiral down as a global credit crunch unfolded. Banks, once seen as pillars of security, turned shaky overnight. Investors flooded broker phone lines with sell orders, terrified that a complete financial meltdown was at hand. Even strong companies with healthy balance sheets were dragged down in the panic. When relief eventually arrived and the market reversed, many had already dumped their holdings. In both the mania and the meltdown, an overemphasis on short-term emotion sealed the fate of late entrants and panic sellers.
Bullish divergence offers a subtle counter to these emotional extremes. By its very nature, it requires looking at a chart, absorbing data points, and asking whether a persistent sell-off might be primed for a turning point. That stands in contrast to reactionary behaviour fuelled by media soundbites. As mass psychology swings from greed to fear and back again, divergence patterns encourage a calmer, evidence-based approach. The method does not demand that you suppress emotion entirely—everyone feels flickers of greed and fear—but it can steer you to test whether the market’s gloom or exuberance aligns with what the momentum indicators reveal.
Another key insight from bullish divergence is that markets often make final lows in a flurry of capitulation when even the more hopeful traders surrender. This final wave of selling might push prices to a new trough, but if indicators remain stable or turn up, it suggests that selling pressure is weaker than it appears on the surface. The subsequent rebound can be surprisingly swift, leaving those who waited for “total clarity” in the dust. By respecting the signals of divergence, an investor can buy closer to the bottom, manage risk, and hold through the initial bounce, ultimately thriving when the crowd belatedly realises the worst is over.
Lessons from Past Market Storms
When seeking concrete examples of bullish divergence, two major events often crop up: the dot-com collapse and the 2008 financial crisis. Although drastically different in their triggers—one hinged on sky-high tech valuations, the other on subprime loans—the aftermath in both cases challenged investors to remain patient and open-minded amid widespread turmoil. Certain traders spotted repeated bullish divergence on various stocks and market indices in the depths of these sell-offs. While no single indicator guaranteed success, these patterns—especially when confirmed by reduced volume on declines—alerted those traders to possible bottoms.
Consider the early 2009 period, just after the Lehman Brothers had pummeled the markets collapse. Major indices formed lower lows, stoking fear of an unending slump. However, the RSI in some top-tier stocks made higher lows, an unmistakable sign that downward momentum was stalling. Savvy observers recognised that the selling intensity had faded despite conditions seeming dire. By accumulating positions and setting tight stop-loss levels, they benefited from the volatile upswing that took shape once government rescue plans and improved liquidity began restoring confidence.
Past disasters highlight the pitfalls of herd mentality. When the dot-com bubble burst, tech stocks tumbled so far that some well-capitalised firms (with real products and growth) were trading at bargain prices. Had traders relied only on negative news headlines proclaiming the end of the tech sector, they might have missed the chance to buy into serious long-term winners. By contrast, those who looked for bullish divergence and found it in certain oversold shares positioned themselves to profit once the selling frenzy abated. Such episodes confirm that stoking one’s curiosity for chart signals can open windows of opportunity in the darkest times.
In a broader sense, these storms also underline the value of healthy scepticism. When a mania is in full swing, it can appear as though prices will rise indefinitely. When a crash envelops the markets, some believe everything will continue to sink forever. Both extremes ignore the cyclical nature of financial markets. Recognising that any slump eventually reaches a point where selling exhausts itself can be a huge edge, especially if a trader couples that belief with objective evidence from a bullish divergence signal.
Building a Forward-Looking Plan
Amid market chaos, a defined plan separates disciplined traders from impulsive speculators. Bullish divergence offers a critical edge, signaling opportunities when the herd succumbs to fear. A solid plan identifies key indicators—such as RSI, MACD, or volume trends—and outlines how to act decisively when divergence arises. Combined with robust risk management, like stop-loss orders to limit damage and profit-taking strategies to lock in gains, traders can navigate uncertainty with confidence.
History shows the value of this approach: those who spotted and acted on divergence during past crises—whether the dot-com crash or 2008 meltdown—reaped significant rewards. Yet success also demands psychological fortitude. Markets amplify fear and greed, tempting investors to abandon reason for the crowd’s frenzy. By grounding decisions in logic and charts, rather than headlines or peer pressure, traders gain the clarity to exploit opportunities overlooked by the majority.
In the theater of markets, fear commands the loudest stage, but bullish divergence reveals the quiet truth. It whispers of strength where others see weakness, rewarding the patient, the cunning, and the disciplined. When panic reigns, the crowd may falter—but those who read the charts and trust reason will find opportunity waiting in the chaos.