Intro: AMD Stock Forecast 2023 Analysis and Insights
Updated May 2023
In stock market analysis, combining mass psychology and contrarian analysis can significantly enhance our understanding of market dynamics and improve our ability to make profitable investment decisions. While MACD and RSI indicators provide valuable insights into stock market bottoms, integrating the study of mass psychology can further enhance our understanding and timing.
One of the critical principles in mass psychology is that the best time to buy is often when the masses are scared or nervous. Applying this principle to the case of AMD stock forecast, we observe that since the middle of 2022, the masses have exhibited nervousness about getting into AMD. This aligns with the concept that high anxiety levels are typically associated with stock market bottoms. Therefore, when analyzing AMD stock using MACD and RSI indicators, it becomes essential to consider the sentiment of the masses alongside these technical indicators.
Examining historical data, we can find numerous instances where the combination of MACDs and RSI accurately predicted stock market bottoms for AMD. After the MACDs and RSI indicators bottomed, AMD experienced significant gains, often reaching several hundred percentage points from its lows. The magnitude of these gains was even more pronounced when the RSI and MACDs traded in the extreme zones, indicating oversold conditions.
AMD Stock Forecast 2023: Unleashing Insights with MACDs and RSI Analysis
When analysing stock market bottoms, MACD and RSI indicators are two popular tools traders, and investors use. In this article, we’ll look at how these indicators have predicted stock market bottoms in the past, explicitly concerning AMD stock forecast.
Before we dive into how these indicators have predicted AMD stock forecast, it’s crucial to understand how MACDs and RSI work. MACD, or Moving Average Convergence Divergence, is a momentum indicator that measures the relationship between two moving averages. RSI, or Relative Strength Index, measures the speed and change of price movements.
The Role of Sentiment:
Sentiment analysis is crucial when analyzing the AMD stock forecast for 2023. Understanding the prevailing market sentiment is essential in identifying potential stock market bottoms and making informed investment decisions. By incorporating sentiment indicators alongside technical tools like MACDs and RSI, we can gain a comprehensive perspective on the market dynamics surrounding AMD.
During stock market bottoms, investor anxiety and fear tend to be high. By monitoring sentiment indicators, we can gauge the overall sentiment towards AMD and recognize when the masses are nervous or hesitant to invest. Contrarian thinking suggests that buying when others are fearful can lead to profitable opportunities. Combining sentiment analysis with technical insights allows us to pinpoint potential entry points when low sentiment is aligned with positive signals from MACDs and RSI.
Sentiment analysis complements technical indicators by providing insights into the emotional aspects driving market behaviour. It helps us understand investor psychology and the broader market trends impacting AMD’s performance. By considering sentiment alongside MACDs and RSI, we can make more intelligent investment decisions, capitalizing on potential shifts in sentiment and market dynamics.
Integrating sentiment analysis, MACDs, and RSI ultimately empowers us to navigate the AMD stock forecast with a more comprehensive understanding. It enables us to identify potential buying opportunities when negative sentiment aligns with positive technical signals. By recognizing the role of sentiment and combining it with technical analysis, we can position ourselves for potential gains and make informed investment choices in the dynamic world of AMD stock.
AMD Stock Forecast: What’s next
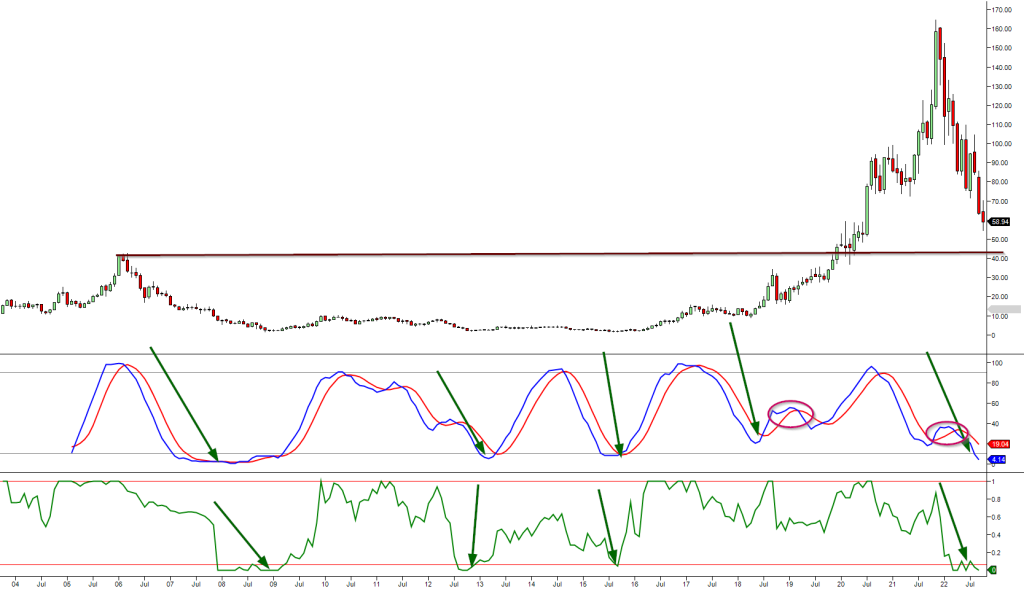
In every instance, after the MACDs and RSI bottomed, AMD tacked on several hundred percentage points in gains from its low. The gains were more pronounced when the RSI and MACDs traded in the extreme zones.
Case Studies:
Let’s examine the last three moves from the above chart. Values will be taken when the MACD’s bottomed and Topped.
Sept 2015 low of 1.65 Feb 2017 High 15.55
April 2018 Low 9.05. Now the MACDs topped (Sept 2018) in the oversold ranges, which is very bullish but let’s assume we use this topping as the end of another cycle. Sept 2018 High 34.14
However, if we start from April 2018 and continue until the MACDs traded in the overbought ranges, this is what we would get April 2018 Low: 9.05 August 2020 high: 94
AMD Stock Forecast 2023: Gains and Cycles:
The lowest gain AMD tacked on in the above three instances was 270%. In each case, AMD at least tacked on gains of 270% for the record; the 270% gains were an incomplete cycle. Complete MACD cycles almost generated gains of 10X.
The Fascinating Setup:
Now, look at the fascinating setup, which matches what occurred from April 2018 to Sept 2018 (red circles) and Oct 2021 to Jan 2022. In both instances, the MACDs topped out in the oversold ranges, and the subsequent bullish crossover led to outsized gains. Whenever the MACDs top out prematurely, the next bullish crossover usually triggers an explosive move. One only has to grab 100% of this move via an option to hit a huge home run.
Conclusion:
In summary, the integration of MACD and RSI analysis with the principles of mass psychology and contrarian thinking can significantly enhance our understanding of the AMD stock forecast for 2023. By incorporating sentiment analysis and recognizing the significance of investor psychology, we can improve our timing and decision-making in the stock market.
The historical data and case studies highlight the effectiveness of MACD and RSI indicators in predicting stock market bottoms and subsequent gains for AMD. The masses’ nervousness or fear indicates a potential buying opportunity. By recognizing this sentiment and combining it with technical indicators, we can identify optimal entry points and maximize our potential returns.
Buying when others are fearful aligns with the principles of contrarian analysis. Going against the crowd can be profitable, as it allows us to capitalize on market overreactions and take advantage of undervalued assets like AMD. By resisting the urge to follow the herd, we position ourselves to benefit from the subsequent price appreciation when sentiment shifts and the masses catch up.
However, it is essential to note that no analysis or indicator can guarantee future performance or eliminate all risks. Combining MACD and RSI analysis with mass psychology insights is a valuable tool in decision-making but should be complemented with comprehensive research, diversification, and risk management.
As we navigate the AMD stock forecast for 2023, it is crucial to remain vigilant, adapt to changing market conditions, and continuously reassess our strategies. By staying informed, utilizing technical indicators, and understanding the psychology of market participants, we can position ourselves for success in the dynamic world of stock market investing.
In conclusion, integrating MACD and RSI analysis with a thorough understanding of mass psychology and contrarian thinking empowers us to make more informed investment decisions. It enables us to identify potential stock market bottoms, capitalize on opportunities when the masses are nervous, and potentially achieve significant gains in the AMD stock for the forecasted year of 2023.
Faq: AMD Stock Forecast 2023
Q: What are MACDs and RSI indicators?
A: MACD stands for Moving Average Convergence Divergence and is a momentum indicator that measures the relationship between two moving averages. RSI stands for Relative Strength Index and measures the speed and change of price movements.
Q: How do MACDs and RSI work?
A: MACD compares the values of two moving averages, typically a short-term and a long-term moving average, to identify potential trend reversals. RSI calculates the ratio of upward and downward price movements over a specific period, indicating whether a stock is overbought or oversold.
Q: How are MACDs and RSI used in stock market analysis?
A: Traders and investors use MACDs and RSI indicators to identify potential stock market bottoms or reversals. These indicators help gauge market sentiment, momentum, and the likelihood of a price trend change.
Q: Why is sentiment important in stock market analysis?
A: Sentiment refers to market participants’ overall attitude or emotional state. During stock market bottoms, high anxiety levels are often present. Understanding sentiment can provide additional context to the analysis and help assess the potential timing of market bottoms.
Q: How have MACDs and RSI predicted stock market bottoms in relation to AMD stock?
A: In the past, when MACDs and RSI indicators reached their bottom levels, AMD stock experienced significant gains afterwards. These gains were more pronounced when the RSI and MACDs were in extreme zones (oversold or overbought).
Q: Can you provide case studies or examples of how MACDs and RSI worked for AMD stock?
A: Here are a few instances to illustrate the gains and cycles observed in AMD stock based on MACDs and RSI indicators:
– September 2015 low: 1.65 | February 2017 high: 15.55
– April 2018 low: 9.05 | September 2018 high: 34.14
– April 2018 low: 9.05 | August 2020 high: 94
In each case, AMD stock experienced significant gains, with the lowest gain being 270%. Complete MACD cycles generated gains of up to 10 times the initial value.
Q: What is the significance of the “fascinating setup” mentioned in the text?
A: The “fascinating setup” refers to instances where the MACDs topped out in oversold ranges, similar to what occurred between April 2018 and September 2018 and October 2021 and January 2022. These scenarios often led to bullish crossovers and subsequent outsized gains. When the MACDs top out prematurely, the next bullish crossover can trigger an explosive move, presenting potential opportunities for traders and investors.
Q: How can traders and investors utilize MACDs and RSI for AMD stock analysis?
A: By combining MACD and RSI indicators with sentiment analysis, traders and investors can gain valuable insights into potential stock market bottoms and reversals. These indicators can help determine optimal entry and exit points for buying and selling AMD stock.
Q: What is the conclusion of this analysis?
A: The conclusion is that when analyzing AMD stock, MACD and RSI indicators, along with sentiment analysis, can provide valuable insights. By considering technical indicators and market sentiment, traders and investors can make more informed decisions regarding when to buy and sell AMD stock.
Other Articles of Interest

Stock Market psychology chart: Unlock Your Trading Potential

What is the Bandwagon Effect? Exploring Its Impact

Warren Buffett Economy Unveiled: Mastering Financial Wisdom

Copper Market News: Distilling Long-Term Patterns

Stock Market Predictions 2020: Focus On The Trend

Volatility Trading & Stock Market Trends

Seizing the Copper Shortage Opportunity

Uranium Price Chart: Unveiling a Thrilling Long-Term Opportunity

Revamping the 60 40 Rule: Unleashing New Strategies for Success

Current Stock Market Trends: Buying Fear, Selling Euphoria

Best Time To Buy Stocks: Embrace Panic & Seize Opportunity

Psychological Manipulation Tactics: Your Recognition & Defense Guide

Cracking the Pack Mentality: Group Dynamics in Financial Markets

Stock Market Crash 2023: Navigating the Turbulence Ahead