Intro: AMD Stock Forecast 2024 Analysis and Insights
Updated April 30, 2024
In stock market analysis, combining mass psychology and contrarian analysis can significantly enhance our understanding of market dynamics and improve our ability to make profitable investment decisions. While MACD and RSI indicators provide valuable insights into stock market bottoms, integrating the study of mass psychology can further enhance our understanding and timing.
One critical principle in mass psychology is that the best time to buy is often when the masses are scared or nervous. Applying this principle to the AMD stock forecast, we observe that since the middle of 2022, the masses have exhibited nervousness about getting into AMD. This aligns with the concept that high anxiety levels are typically associated with stock market bottoms. Therefore, when analyzing AMD stock using MACD and RSI indicators, it becomes essential to consider the sentiment of the masses alongside these technical indicators.
Examining historical data, we can find numerous instances where the combination of MACDs and RSI accurately predicted stock market bottoms for AMD. After the MACDs and RSI indicators bottomed, AMD experienced significant gains, often reaching several hundred percentage points from its lows. The magnitude of these gains was even more pronounced when the RSI and MACDs traded in the extreme zones, indicating oversold conditions.
AMD Stock Forecast Unleashing Insights with MACDs and RSI Analysis
MACD and RSI indicators are two popular tools traders and investors use to analyse stock market bottoms. Before we dive into how these indicators have predicted AMD stock forecast, it’s crucial to understand how MACDs and RSI work. MACD, or Moving Average Convergence Divergence, is a momentum indicator that measures the relationship between two moving averages. RSI, or Relative Strength Index, measures the speed and change of price movements.
The Role of Sentiment in AMD
Sentiment analysis plays a crucial role in forecasting AMD stock performance for 2023. By understanding the prevailing market sentiment, investors can identify potential stock market bottoms and make informed investment decisions. Combining sentiment indicators with technical tools like MACDs and RSI provides a comprehensive perspective on the market dynamics surrounding AMD.
During stock market bottoms, investor anxiety and fear tend to be high. Sentiment indicators can gauge the overall sentiment towards AMD and help recognize when the masses are nervous or hesitant to invest. Contrarian thinking suggests that buying when others are fearful can lead to profitable opportunities. A study by C. Bai et al. found that considering user sentiments in price forecasts increased the accuracy of prediction models by 20%, highlighting the value of customer sentiment in predicting prices (Bai et al., 2023).
Sentiment analysis complements technical indicators by providing insights into the emotional aspects driving market behaviour. It helps understand investor psychology and the broader market trends impacting AMD’s performance. For example, the CBOE Volatility Index (VIX), also known as the “fear index,” indicates the expected volatility of the S&P 500 index. High VIX levels can signal heightened worries and potentially a market bottom (Corporate Finance Institute, n.d.).
Integrating sentiment analysis, MACDs, and RSI empowers investors to understand the AMD stock forecast more comprehensively. It identifies potential buying opportunities when negative sentiment aligns with positive technical signals. As noted by Investopedia, “Sentiment analysis is widely applied to voice of the customer materials such as reviews and survey responses, online and social media, and healthcare materials for applications that range from marketing to customer service to clinical medicine” (Investopedia, 2021).
Expert opinions support the importance of sentiment analysis in stock market forecasting. According to a primer on sentiment analysis of financial news by Dow Jones, “Institutional investors can still exploit the departures of stock prices from fundamental values because of the news-driven behaviour of retail investors” (Dow Jones, n.d.). The primer also highlights that negative sentiments are more related to market movements than positive ones.
AMD Stock Forecast: What’s next
In every instance, after the MACDs and RSI bottomed, AMD gained several hundred percentage points from its low. The gains were more pronounced when the RSI and MACDs traded in the extreme zones.
Case Studies:
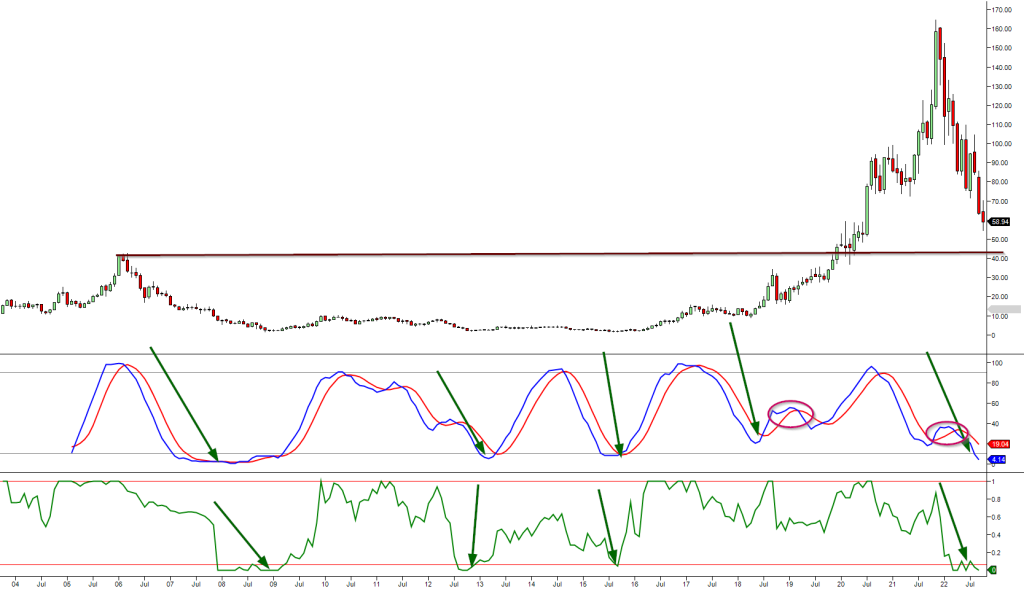
Let’s examine the last three moves from the above chart. Values will be taken when the MACD’s bottomed and Topped.
Sept 2015 low of 1.65 Feb 2017 High 15.55
April 2018 Low 9.05. Now, the MACDs topped (Sept 2018) in the oversold ranges, which is very bullish, but let’s assume we use this topping as the end of another cycle. Sept 2018 High 34.14
However, if we start from April 2018 and continue until the MACDs traded in the overbought ranges, this is what we would get: April 2018 Low: 9.05 August 2020 high: 94
AMD Stock Forecast 2023: Gains and Cycles:
The lowest gain AMD tacked on in the above three instances was 270%. In each case, AMD at least tacked on gains of 270% for the record; the 270% gains were an incomplete cycle. Complete MACD cycles almost generated gains of 10X.
The Fascinating Setup:
Now, look at the fascinating setup, which matches what occurred from April 2018 to Sept 2018 (red circles) and Oct 2021 to Jan 2022. In both instances, the MACDs topped out in the oversold ranges, and the subsequent bullish crossover led to outsized gains. Whenever the MACDs top out prematurely, the next bullish crossover usually triggers an explosive move. One only has to grab 100% of this move via an option to hit a huge home run.
Conclusion:
Integrating MACD, RSI, and sentiment analysis can significantly enhance the understanding of AMD’s stock forecast for 2023. Historical data and case studies highlight the effectiveness of MACD and RSI indicators in predicting stock market bottoms and subsequent gains for AMD (Hahn-Tech, LLC, n.d.). Sentiment analysis complements these technical indicators by providing insights into investor psychology and market trends (Investopedia, 2021).
Contrarian thinking suggests that buying when others are fearful can lead to profitable opportunities. A study found that considering user sentiments in price forecasts increased prediction accuracy by 20% (Bai et al., 2023). The CBOE Volatility Index (VIX) can signal heightened worries and potentially a market bottom (Corporate Finance Institute, n.d.).
However, no analysis or indicator guarantees future performance or eliminates risks. Combining MACD, RSI, and sentiment analysis should complement comprehensive research, diversification, and risk management. Adapting to changing market conditions and continuously reassessing strategies is crucial for success in the dynamic world of stock market investing.
In conclusion, sentiment analysis is valuable for investors seeking to make informed decisions about AMD stock in 2023. By combining sentiment indicators with technical analysis, investors can better understand market dynamics and potentially identify profitable opportunities. As the famous investor Warren Buffett once said, “Be fearful when others are greedy, and greedy when others are fearful” (Schnell, 2020).
Other Articles of Interest

Unraveling Crowd Behavior: Deciphering Mass Psychology

Dogs of the Dow 2024: Barking or Ready to Bite?

Zero to Hero: How to Build Wealth from Nothing

The Power of Negative Thinking: How It Robs and Bleeds You

Contrarian Outlook: A Pathway to Breakthrough or Breakdown

Mass Psychology Unveiled: The Hidden Keys to Financial Triumph

Overconfidence Bias: The Investor’s Blind Spot

Panic Selling is also known as capitulation in the markets

Examples of Groupthink: Instances of Collective Decision-Making

Herd Behavior: The Perilous Path to Market Missteps

Disciplined Growth Investors: Path to Maximum Gains

Stock Market Crash Forecast: Ignore the Hype, Focus on the Trend

Mob Mentality Psychology: Outsmart the Masses and Win Big

When is the Next Stock Market Crash Prediction: Does it Matter?

2020 COVID Stock Market Crash: Panic Meets Opportunity
Unveiling Falsehoods: Which of the Following Statements About Investing is False
