
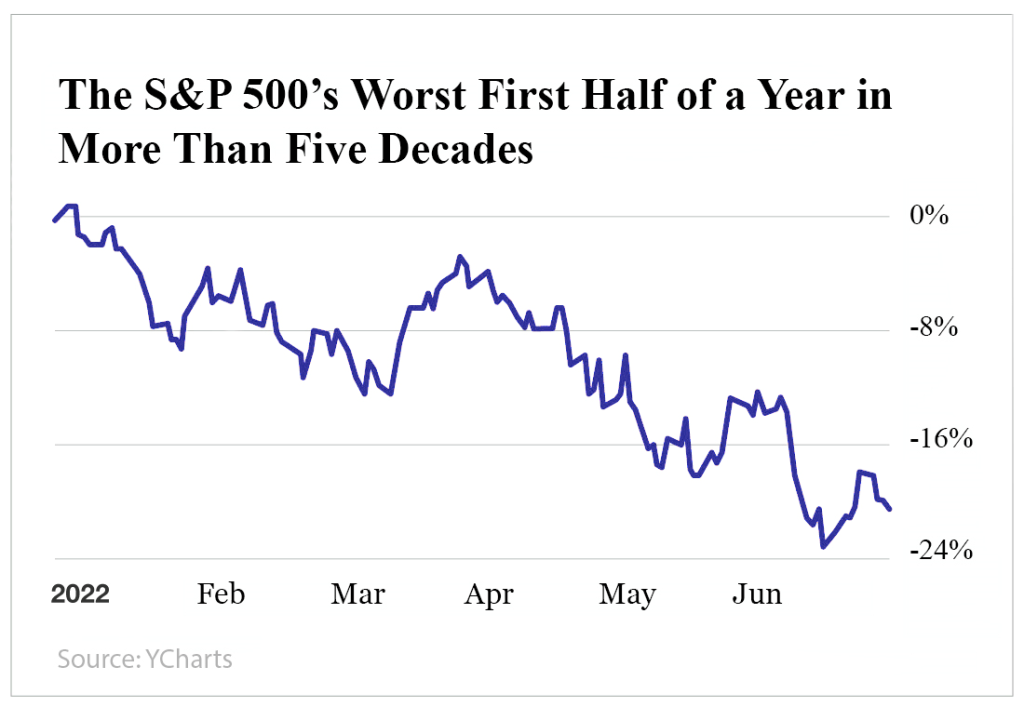
Is It The Worst 25-year period in stocks?
Dec 2022
No, it’s not the worst 25-year period in stocks; it’s actually worse. Think almost 50 years, which means a tremendous opportunity is relatively close. Don’t mistake close at hand for around the corner. There will be one strong head fake and a final selling climax wave.
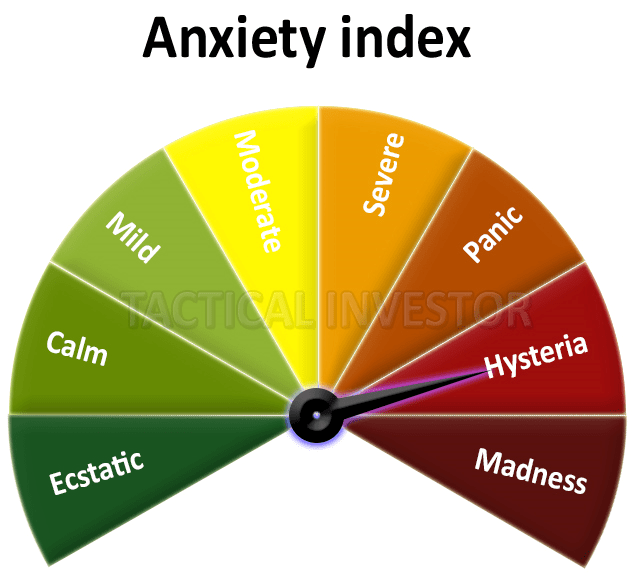
Bullish sentiment is still well below its historical average of 39; the current reading is 24. Fund managers and most financial professionals focus on the recession factor. Too late, the markets are forward-looking and have already factored in all these developments. Hence, the rally after the disappointing GDP data and the Fed raising rates again.
Contrarian Perspective on the Worst 25-year period in stocks
This is a positive development from a contrarian angle, confirming that the masses will react incorrectly. They Zag when they should zig and jump out of the window when they should be taking a siesta. Now we are in rally mode, so aggressive traders can use strong pullbacks in the Dow (ranging in the 300 to 600 ranges to add to their long positions. The markets are expected to top in October; one should not confuse topping out with an immediate plunge. Markets seldom crash immediately after putting in a top; they go through a topping process.
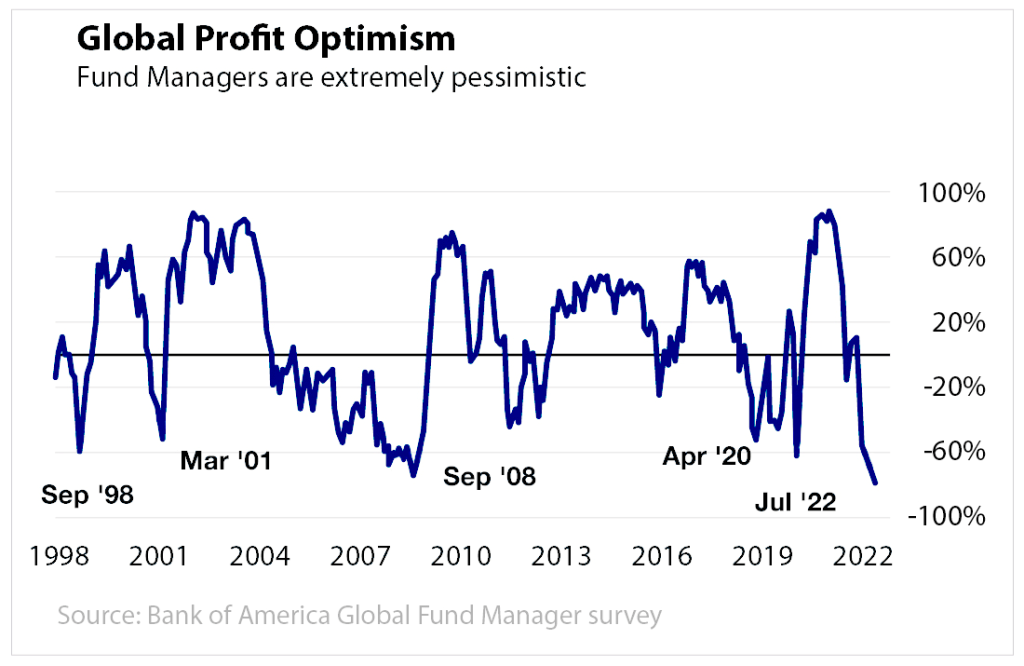
If you plot that chart against the Dow or SPX, you will notice that extreme moves correspond with market bottoms. However, one must remember that while history repeats itself, it never takes the same path. We suspect their pessimism levels would have to dip below the 2008 lows, confirming that another potentially more severe downward leg should follow the current market bounce.
A Secondary and more potent buy signal has been triggered. However, a new buy signal on the longer timelines is almost always accompanied by a minor sell signal in the short term.
The SP500 could test the 3870-3900 ranges, and, barring a black swan event, this would represent another buying opportunity. After that, it is projected to blast through resistance in the 4130 to 4150 ranges, which will/should trigger a robust rally. It will likely test the 4500 to 4600 ranges before topping out. Market update July 24, 2022
Corrective phase
The markets are entering a corrective phase; the SPX has hit short-term targets. Former support points turned into resistance which should turn into zones of support again, albeit on a short-term basis. The likely pullback targets fall in the 3960 to 4020 with a decent chance of overshooting as low as 3870.
We are now at the Push stage; the market usually runs into some resistance here. The market will release steam and trend sideways for 3 to 9 trading days. Market update July 24, 2022
Kick—-Fall—–Base—-Push——Thrust——Plateau——Plunge
The markets have now made it slightly past the PUSH stage, but resistance is expected; they should consolidate over the next several days. This short-term pullback will give the markets the force necessary to break out towards the Thrust phase. Resistance from mild to medium will be encountered as each stage is breached. We are now close to hitting the fast and furious point, which should last until the end of the thrust zone.
Conclusion
It’s not the worst 25-year period in stocks, but worse, as we stated earlier. As the equation must always balance, this volatile and painful period will follow a long bullish phase. The markets still need to undergo one more selling wave (probably set to occur around Oct 2022), but once that is done, it will lay the groundwork for a stellar bull. We have codenamed this cybernetic bull as it will be the most muscular bull ever.
While bullish sentiment has risen, it is still trading well below its historical average of 39.00. Experts and the masses remain nervous; the path of least resistance is up until September-October.
Empowering Ideas: Thought-Provoking Reads
Oil Supply Outstrips Demand: Oil Headed Lower 2016
Oil Crash: Crude oil price heading lower 2016