Stock Market Swings: A Window of Opportunity for Smart Money
Updated Jan 19, 2026
Are the Days of Big Drops Over?
Maybe the fat lady hasn’t sung yet, but she’s definitely warming up backstage. And if you’ve been around the markets long enough, you know she doesn’t perform on schedule—she belts it out precisely when you’re either euphoric or asleep at the wheel.
Let’s get something straight: you don’t tell the market what to do—you watch her footsteps in the sand, read her breath in the volume, feel her mood in the volatility. You don’t predict; you position. Spot the trend, align your sails, and ride the wind.
Every Crash Whispers a Setup
History doesn’t repeat itself verbatim, but it hums familiar tunes. If you know where to listen, you’ll hear the setups forming long before the crowd catches on.
The 2000–2002 Dot-Com Crash
A tech bloodbath that wiped out paper fortunes overnight. But if you watched semiconductors crawl out of the rubble by 2003, you saw the early footprints of what would become NVIDIA, AMD, and a biotech renaissance. The trend was shifting—mass psychology gave you the setup, the chart gave you the entry.
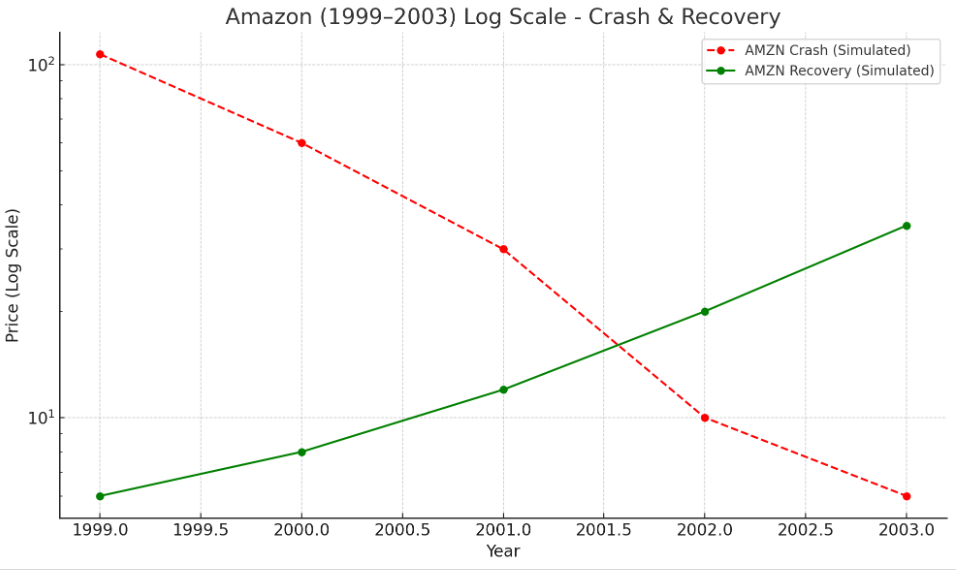
Amazon’s journey from $107 to under $6 told a brutal story—then a stealth reversal began. Flatlining RSI, rising on-balance volume, and breakout volume off the $10 level showed buyers returning long before the crowd woke up. That wasn’t luck. That was readable.
The 2008–2009 Financial Crisis
This wasn’t just about subprime mortgages—it was a complete collapse in trust. But within the wreckage, patterns spoke louder than the panic. Take Citigroup: once trading north of $500 (pre-reverse-split), it cratered to under $1 by early 2009.
But if you zoomed in on the price action around February–March 2009, you could see the tell:
- Volume exploded while price barely moved lower—classic capitulation.
- MACD crossed above its signal line after months in negative territory.
- RSI formed a bullish divergence—price made lower lows, but RSI made higher lows.
- The 200-day moving average began to flatten for the first time in over a year.
These weren’t bullish headlines. These were behavioral footprints. The funds that missed the bottom only realized it when Citi doubled within weeks—off literal pennies.
March 2020 COVID Crash
The fastest 30% drop in S&P history. Limit down after limit down. Oil went negative. Treasuries seized up. Even gold got dumped in the liquidity panic.
But the SPX formed a classic V-shaped reversal:
- On March 23, the index tagged around 2190—right as the VIX spiked above 80, echoing 2008 levels.
- That same day, volume surged across the board.
- The SPX printed a bullish engulfing candle on the daily timeframe within days.
- Fed liquidity injections played a role, sure—but it was sentiment exhaustion that really broke the free fall.
You could literally feel the despair peak—and then watch price start to ignore bad news. That’s your tell. That’s the moment the script flips.
Bitcoin’s COVID Panic Bottom
Bitcoin plunged from around $9K to below $4K in a heartbeat. The order books were empty. Panic was absolute. But then the signs appeared:
- Huge wicks on the 4-hour chart, with 10%+ bounces within hours.
- RSI on the daily chart hit around 15—historically rare territory.
- On-Balance Volume flipped positive days before price action caught up.
- Once BTC reclaimed $6K, it ripped to $10K—while CNBC was still running pandemic death tickers.
It wasn’t just a bounce. It was a regime change—visible in momentum long before it became obvious in headlines.
ARKK’s 2022–2023 Death Spiral and Compression
Cathie Wood’s ARKK ETF dropped from around $160 to roughly $30. Brutal, unrelenting decline. But if you studied the 2023 chart closely:
- The daily candlesticks began to shrink—volatility collapsed.
- Bollinger Bands squeezed tighter than at any point in three years.
- Volume dried up, signaling exhaustion rather than conviction.
- Price hovered near a flat 50-day moving average.
- No one was paying attention anymore—and that’s precisely the setup.
This is classic spring-loading. Price compresses before it expands—up or down. But silence like this often precedes a scream in one direction or the other.
SMH Semiconductor ETF Breakout
While recession talk dominated 2023, semiconductors staged a stealth bull run.
- SMH consolidated for over 12 months, moving sideways in a tightening triangle.
- Higher lows formed while the upper resistance line held firm—classic ascending triangle.
- RSI stayed in the 40–60 zone, a sign of accumulation, not speculation.
- When the breakout came, it arrived on a 40% increase in volume, and it didn’t look back.
Smart money was already in. The headlines came later, as they always do.
Sentiment Is the Trigger. Charts Are the Map.
Even without staring at charts all day, here’s how you read the market’s pulse:
- When volume spikes but price flattens, someone’s absorbing shares.
- When RSI diverges from price, momentum is lying to you.
- When price hovers near moving averages in eerie silence, tension is building.
- When retail sentiment hits extremes, institutions often reverse it.
Peaks in greed mark tops. Panic combined with flat momentum signals bottoms forming. It’s that simple—and that brutal.
So Are Big Drops Over?
No. Big drops never “end.” They go dormant—like volcanoes waiting for the next eruption.
Notice the rhythm? Each panic was followed by steep climbs—but only for those who entered when everyone else was frozen in fear.
Big drops are setups for the bold. Not the hopeful. Not the reckless. For those watching psychology unfold in real-time—and charting where emotion and price collide.
So no, it’s not over. The fat lady’s just backstage, sipping tea and rehearsing her lines. You’ll know when she walks on stage.
Mass Sentiment Plus Technicals: The Market’s Neural Scan
Forget the earnings reports. Forget the economic narratives spun by talking heads. The market isn’t driven by facts—it’s driven by perception of facts, and more precisely, by emotional reactions to that perception. Mass sentiment is the market’s nervous system. You’re not tracking reality—you’re tracking how humans malfunction in real time.
This is where most traders get demolished. They think the market reflects logic. It doesn’t. It reflects a feedback loop of fear-framed logic, a recursive hall of mirrors where the crowd reacts to what it thinks the crowd thinks. That’s why sentiment indicators often matter more than GDP prints.
You track:
- Fund flows to catch groupthink in motion.
- VIX spikes and collapses for emotional whiplash signals.
- Social platforms as digital confessionals where the market’s id leaks out: rage, greed, delusion, hope—all timestamped and algorithmically amplified.
Once you’ve mapped that emotional pressure system, you layer in technicals. But not in the usual indicator-juggling way most retail traders do.
You watch volume like it’s a breath rate—shallow or spiking. You use MACD not to blindly follow trends, but to flag when the music’s still playing but the dancers have already left the floor. Fibonacci levels mark the haunted zones where past trauma lingers in price memory. And moving averages aren’t just lines—they’re tripwires, thresholds where institutional algorithms flip from “wait” to “attack.”
This isn’t trading lines on a screen. This is emotional surveillance.

Big Drops Don’t Die. They Go Fermenting.
Sharp corrections don’t end cleanly. They sink beneath the surface and rot. Later, they explode as something else entirely—usually when you least expect it.
Retail thinks a drop is over when the candle turns green. That’s adorable, but naive.
The real story happens in the unwind—the slow bleed of liquidity, the creeping withdrawal of confidence, the systemic numbness that sets in. It’s not the crash that wrecks most people—it’s the post-crash paralysis that quietly eats their capital and conviction in equal measure.
So no, the monster’s not dead. It’s just wearing new clothes: low-volume rallies, hyper-narrow leadership, beta-chasing behavior, fakeouts stacked on fakeouts. You won’t get a “safe signal” announced on CNBC. The real setups appear when volatility peaks and everyone’s emotional bandwidth is completely maxed out.
This is where smart money feasts.
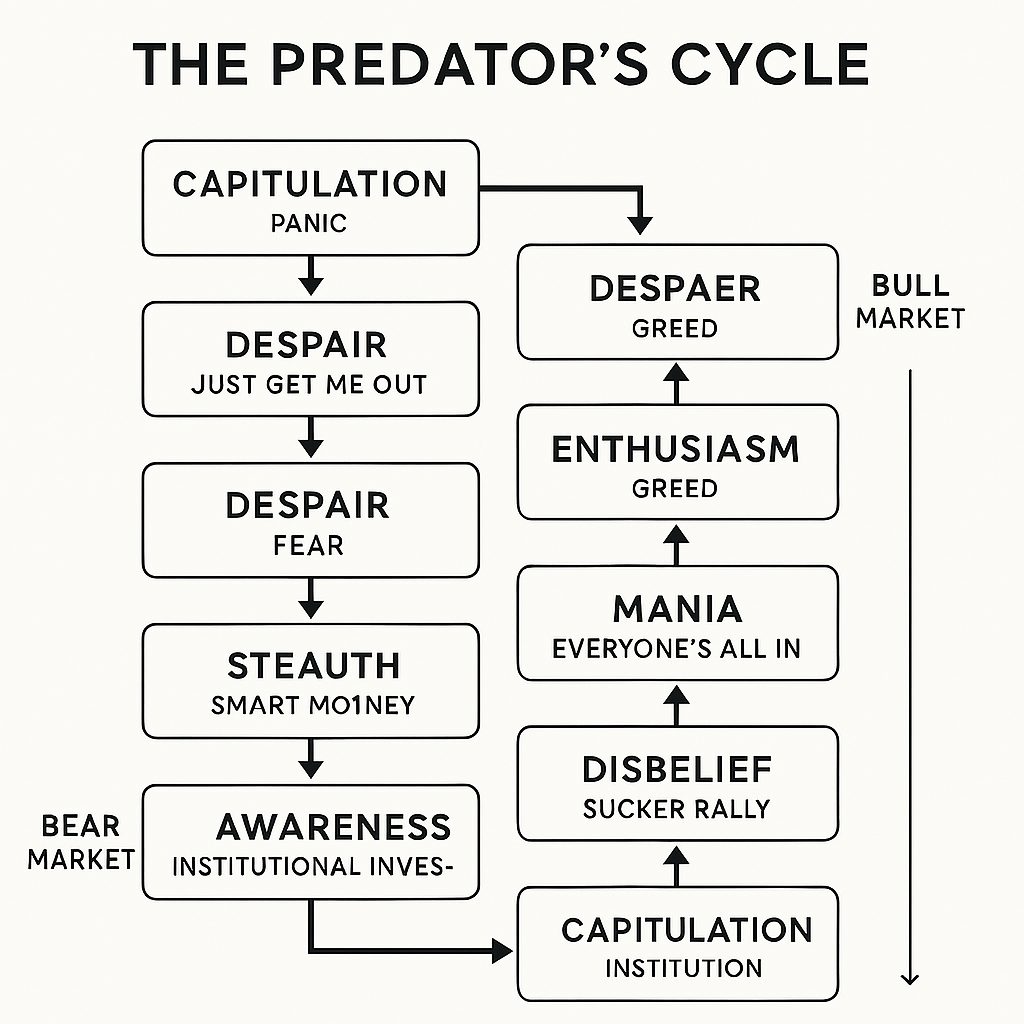
Not because they guess right more often. But because they move like predators:
- Wait patiently for asymmetry.
- Strike when sentiment detaches completely from underlying reality.
- Exploit exhaustion, not excitement.
- Trust the chart—but read the crowd beneath it.
The real players aren’t chasing reversals. They’re hunting collective delusion and positioning before it breaks.
The Myth of Stabilization: When Flatlines Lie
Flat periods aren’t safety—they’re suppressed volatility waiting to explode. Think of them as market coma states—neither bullish nor bearish, but psychologically ambiguous, which actually makes them more dangerous than clean drops.
During these stretches, traders get overconfident because nothing appears to be “happening.” But something always is. Flat action breeds risk through complacency. Indicators soften, narratives reconstitute themselves, and time decay quietly eats away at clarity.
Meanwhile, positioning gets extreme—bulls crowd in because “the worst is over,” and bears overstay their welcome because “this is just a pause before the next leg down.” Both sides are wrong because the structure hasn’t actually resolved. What looks like calm is really pressure with nowhere to go.
- You watch for coiling patterns forming.
- You watch breadth divergence—where the index flatlines but internals quietly break down.
- You check options skew—where traders quietly hedge while publicly pretending to be long.
By the time the move finally starts, the crowd is completely misaligned. One side gets wrecked instantly. The other thinks they’ve won until the reversal snaps back violently.
That’s the magic of flatlines. They lull both predator and prey into complacency—and only reward those who recognize the trap is actually the setup.
Final Word
If you’re not reading psychology beneath the raw data, you’re flying blind. If you’re not watching price behavior with one eye constantly on crowd behavior, you’re not trading—you’re gambling and hoping.
The market isn’t a puzzle with a clean solution. It’s a behavioral simulation running in real time. Every candle is a signal. Every pause is a calculated feint. Every sentiment spike is a countdown timer ticking toward the next move.
And no—the fat lady hasn’t sung. She’s just back in makeup, rehearsing Act II. When she finally walks on stage, most of the audience will be caught completely off guard. Don’t be part of that crowd.