
Stock Market Psychology Chart: Your Emotional Investing Compass
Updated May 1, 2024
Often perceived as a rational entity, the stock market is significantly influenced by its participants’ collective emotions. The stock market psychology chart is a powerful tool for visually depicting this emotional interplay across different market cycles.
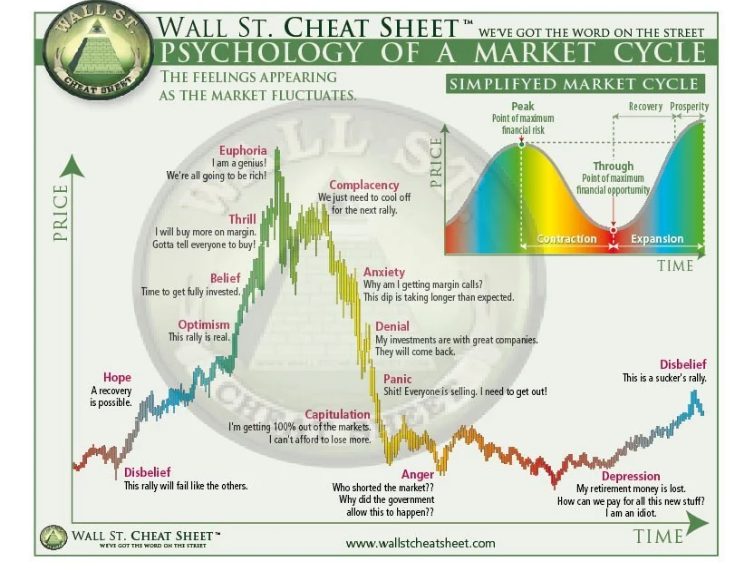
This chart maps out the typical emotional states investors experience as the market fluctuates, including stages like optimism, excitement, euphoria, anxiety, fear, panic, despair, and hope. Understanding these emotional patterns is crucial for investors to make informed decisions and avoid the pitfalls of irrational exuberance or panic selling.
For example, during a bull market’s euphoric “thrill” stage, investors often get caught up in the excitement of rapidly rising stock prices. Conversely, a market downturn’s “panic” stage is characterized by widespread fear and hasty selling. Recognizing these emotional extremes can help investors resist making impulsive decisions based on short-term market movements.
Interestingly, the stock market psychology chart parallels Pavlov’s theory of classical conditioning. Just as Pavlov’s dogs were conditioned to respond to specific stimuli, investors and even high-frequency trading algorithms can react to particular market indicators or reports, sometimes leading to volatility and irrational behaviour.
While not foolproof, the stock market psychology chart offers invaluable insights into emotions’ influence in market movements.** By understanding and managing their emotions, investors can avoid the pitfalls of buying high and selling low. **Success in the stock market ultimately comes down to discipline, patience, and a deep understanding of market psychology, ideally complemented by sound technical analysis.
The path to profitable investing becomes much more manageable once you grasp and adhere to these fundamental rules while steering clear of speculative behaviour. **Mastering your emotions and understanding market psychology is key to unlocking your full potential as an investor in the stock market’s complex and emotionally charged world.**
At Tactical Investor, we follow a straightforward philosophy. We leverage the power of Mass Psychology by combining sentiment data with our proprietary tools, such as the Anxiety Index, Stupidity Index, and Bull and Bear Sentiment Index, along with technical analysis. We use these insights to offer clear and straightforward instructions on deciphering complex patterns and executing successful strategies.
Navigating the Emotional Seas: The Stock Market Psychology Chart
The stock market is a complex ecosystem in which human emotions significantly influence movement. The stock market psychology chart is a powerful tool to help investors understand and navigate these emotional currents.
This chart visually represents the collective emotional states of investors at different stages of a market cycle. The horizontal axis represents market valuation relative to its fundamentals, from oversold to overbought. The vertical axis charts prevailing emotions, from fear and despair to hope and greed.
As the market fluctuates, so do investors’ emotions:
– During rising prices, optimism, denial, hope, and euphoria dominate.
– In downturns, anxiety, fear, and panic take hold.
Savvy investors use these emotional stages as contrarian signals to time entries and exit against the crowd. For example, despair after panicked selloffs often lays the groundwork for a new bull market—an opportunity to buy rationally when others are capitulating irrationally.
The chart also accounts for cognitive biases like overconfidence and loss aversion that can distort mass views during critical phases. Identifying divergences between emotional indicators and fundamentals can foresee trend changes.
Other influential emotions include:
– Hope: Holding losing positions too long, believing in a turnaround
– Regret: Selling winners too early, fearing loss of gains
– Pride & Overconfidence: Taking on excessive risk, ignoring warning signs
– Herd Mentality: Following the crowd, leading to bubbles and crashes
While an inexact social science, plotting emotional patterns within market moves provides a contrarian lens to mitigate behavioural pitfalls across cycles. **Pairing sentiment with other analytical tools empowers investors to navigate the turbulent seas of mass opinion and make more rational, successful decisions.**
Understanding the stock market psychology chart and the emotions driving market movements is crucial for any investor. Recognizing and managing these emotions enables more precise thinking and better investment outcomes in the complex, emotionally charged world of the stock market.
The Inner Workings of a Stock Market Psychology Chart: A Valuable Tool for Traders
A stock market psychology chart is a powerful tool for monitoring the primal emotions of greed and fear. These emotions create self-fulfilling cycles that substantially influence prices over the long run. The chart is divided into two distinct halves, representing optimism and uncertainty.
The fear area depicts periods of angst, with skittish investors hurriedly exiting equity positions. Major sell-offs frequently coincide with capitulation to the downside as pessimism breeds even more profound doubts. Monitoring sell-side pressure through expanded volumes and bearish sentiment gauges helps identify points of maximum distress, which often form bases just above support levels and lay the groundwork for new bull markets.
As fear transforms into hope, bargain hunters seek undervalued companies, forming the initial demand that drives recoveries. Meanwhile, greed involves euphoria and exuberance as excesses emerge on buoyant uptrends. Extended rallies birth overconfidence, with investors rationalizing lofty valuations driven more by emotional contagion than fundamentals.
These halves complete the market cycle pendulum, swinging between unsustainable pessimism and optimism in predictable waves charted against broad benchmarks. The chart distils these emotive patterns, aiding wise portfolio stewardship amid inevitable fluctuations in mass sentiment.
Benefits of Using Stock Market Psychology Charts:
1. Helps tune out noise and remain objective by analyzing sentiment evolution
2. Identifies potential trend changes earlier, before prices fully reverse
3. Prevents chasing momentum and avoids euphoric, late-stage positions
4. Reduces behavioural biases like overconfidence that distort thinking at peaks
5. Promotes contrarian thinking to counter the herd for superior risk adjustment
6. Enhances portfolio discipline through systematic rebalancing rather than panicked reactions
7. Highlights recurring emotion patterns during multi-year bull and bear cycles
Using Stock Market Psychology Charts for Trading:
Understanding market sentiment enables traders to manage risk better, stick to long-term goals, and avoid emotional decisions based on short-term movements. Traders can develop more informed strategies by identifying potential market turning points and using technical analysis.
However, no method is infallible, and market circumstances can change suddenly. Therefore, it is essential to exercise caution, practice risk management, and use these charts in conjunction with other research to make informed investment decisions.
Stock market psychology charts are invaluable for investors and traders. They enable them to manage emotions, identify trends and potential reversals, and make better decisions. When used wisely alongside other analyses, these charts can unlock more significant trading potential in the complex, emotionally charged world of financial markets.
Identifying Market Reversals with Stock Market Psychology Charts
Stock market psychology charts are powerful tools for identifying potential market reversals by monitoring the primal emotions of greed and fear that drive self-fulfilling cycles and substantially influence prices over the long run.
How Psychology Charts Help Spot Reversals:
1. Extreme Greed: When the chart shows investor sentiment reaching extreme greed, with the market well above its long-term average and stretched valuations, it signals a potential reversal.
2. Overconfidence Indicators: Technical indicators like put/call ratios and volatility indexes flashing signs of overconfidence, with low put volumes and complacency, suggest investors dismiss downside risk.
3. Bullish Surveys: High levels of bullishness in surveys and predictions of further gains without credible threat mentions indicate hope has overwhelmed fear.
4. Divergences between fundamentals and sentiment provide early warnings of vulnerability. Promptly lightening exposures into overbought conditions can mitigate portfolio risk ahead of sentiment shifts.
Key Facts and Strategies:
– A market top is imminent if bullish sentiment remains above 60 for a prolonged period.
– A market bottom is likely when bearish sentiment hovers around 60.
– A long-term market bottom approaches when neutral sentiment soars past 55, suggesting significant investor agitation that can last for years.
– Proprietary tools like the Anxiety Index moving to extreme levels indicate impending bullish or bearish trends.
– Combining psychology chart data with technical analysis and mass psychology can yield powerful results.
Avoiding Common Mistakes:
– Overreliance on a single indicator: Confirm signals with multiple indicators to avoid false reversals.
– Ignoring context: Consider the broader market context and fundamentals, not just sentiment extremes.
– Mistiming entries/exits: Use stop-losses and risk management to protect against mistimed trades.
– Neglecting risk: Always consider potential downside and position size appropriately.
Conclusion
Understanding the emotions that drive market movements is critical to successful investing. The stock market psychology chart provides a valuable tool for investors to manage their feelings and make informed investment decisions. As renowned investor Peter Lynch once said, “The key to making money in stocks is not to get scared out of them.”
Investors can avoid making irrational judgments based on transient market fluctuations by studying the stock market psychology chart. They can also stick to their long-term investment goals and avoid buying at the top of the market and selling at the bottom. In the words of Stoic philosopher Seneca, “It is not because things are difficult that we do not dare; it is because we do not dare that things are difficult.”
Moreover, the stock market psychology chart helps investors maintain a balanced perspective, even in market volatility. As French philosopher Michel de Montaigne observed, “The greatest thing in the world is to know how to belong to oneself.” By understanding and managing their emotions, investors can stay true to their investment strategies and avoid getting caught up in the herd mentality.
Discover More: Stimulating Articles That Will Captivate You

AI Chip Manufacturers: Navigating Challenges in a Dynamic Market

Random Reflections on AI

The Rich Get Richer: Understanding Wealth Inequality

Market Trend Analysis: Only The Trend is your friend

What is inflation? Central Bankers Main Weapon Is Inflation

The United States Central Bank: Catalyst for New Servitude

Stock Market Trends 2023: Market on the Verge of a Crash?

The Good Price to Sales Ratio: Unleashing Investment Insights

The Banksters Band: Exploiting the Poor to Enrich the Wealthy

The Disciplined Investor: A Guide to Enduring Trading Success

Bull vs Bear Market; the Dow Index is getting ready to Soar

Clipping Coinage: Prelude to Fiat Currency Abuse

Is Crude oil headed higher or lower?

Finally Dopey Hollande Admits Islam Problematic for France