Move on for it takes very little effort to stand still and do nothing. Sol Palha
CHKP Stock Price: Taking Flight or Holding Steady?
Updated March 10, 2024
Check Point Software Technologies Ltd., founded in 1993 and headquartered in Tel Aviv, Israel, is a global leader in cybersecurity solutions. The company provides a wide range of products and services, including:
1. **Network Security**: Next-Generation Firewalls, Security Gateways, and Virtual Systems
2. **Cloud Security**: CloudGuard for automated cloud security and compliance
3. **Endpoint Security**: Harmony Endpoint, Endpoint Detection and Response (EDR)
4. **Mobile Security**: Harmony Mobile for protecting mobile devices and applications
5. **Security Management**: Unified security management architecture with R81 release
As of 2023, Check Point has over 5,800 employees worldwide and serves more than 100,000 organizations of all sizes across various industries in over 80 countries.
Financial Performance
– In Q4 2022, Check Point reported revenue of $599 million, a 7% increase year-over-year
– Total revenue for 2022 was $2.33 billion, a 6% increase compared to 2021
– GAAP operating income for Q4 2022 was $270 million, representing 45% of revenues
– Non-GAAP operating income for Q4 2022 was $299 million, representing 50% of revenues
– As of December 31, 2022, the company had $3.72 billion in cash balances, marketable securities, and short-term deposits
Stock Price Analysis
Check Point’s stock (NASDAQ: CHKP) has experienced fluctuations over the past year, with a 52-week range of $107.54 to $149.62 as of March 30, 2023. Factors influencing the stock price include:
1. Consistent revenue growth and strong profitability margins
2. Increasing demand for cybersecurity solutions due to the evolving threat landscape
3. Competition from other cybersecurity providers
4. Global economic conditions and market sentiment
Despite short-term fluctuations, many analysts maintain a positive long-term outlook for Check Point, given its strong market position, diverse product portfolio, and consistent financial performance. However, investors should always consider their individual risk tolerance and investment goals when making decisions.
CHKP Stock EPS ratio

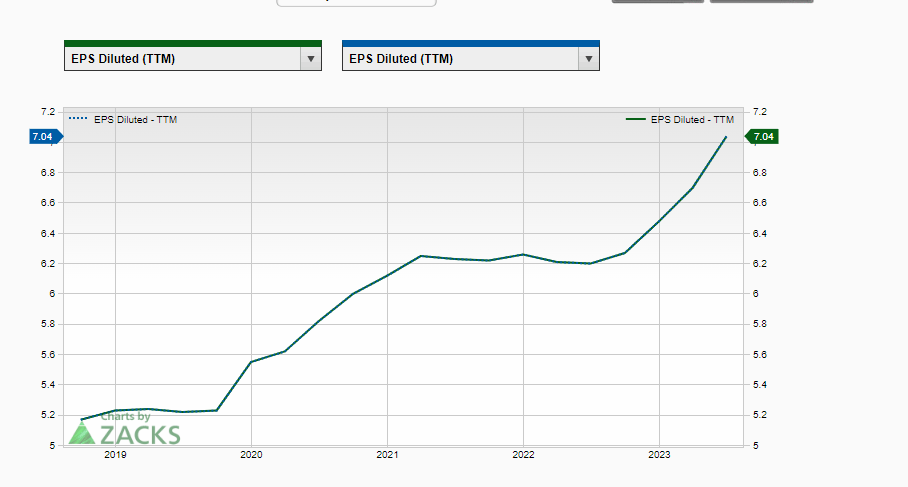
Over the last four years, a consistent upward trend in Earnings Per Share (EPS) has been consistent, signalling a robust and thriving business environment. This positive trajectory underscores the notion that any significant pullback should not be viewed with apprehension but rather embraced as an opportunity. It suggests that the company has been effectively managing its resources to generate increased profits, a testament to its robust financial health. This upward EPS trend is a promising sign for investors, as it often precedes stock price appreciation. Therefore, any temporary market downturns or pullbacks should be seen as potential investment opportunities rather than causes for concern.

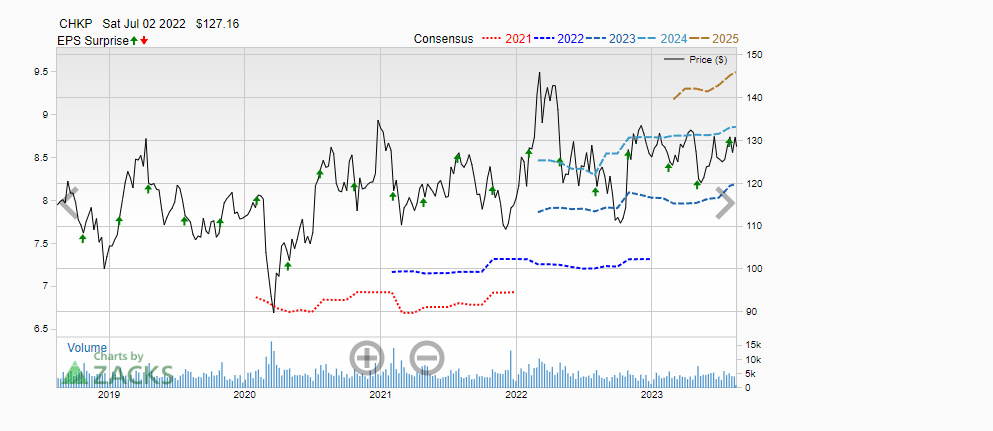
Based on the latest data, Check Point Software Technologies Ltd. (CHKP) is expected to continue its growth trajectory in the cybersecurity industry. Analysts from Zacks Investment Research project that the Earnings Per Share (EPS) will start to trend upward after reaching a peak in 2022. This is mainly due to cybersecurity’s increasing importance in the Artificial Intelligence (AI) era. Given these factors, it is highly conceivable that CHKP’s EPS could match and surpass its 2022 highs well before 2025.
CHKP Profit Margin and P/S ratio

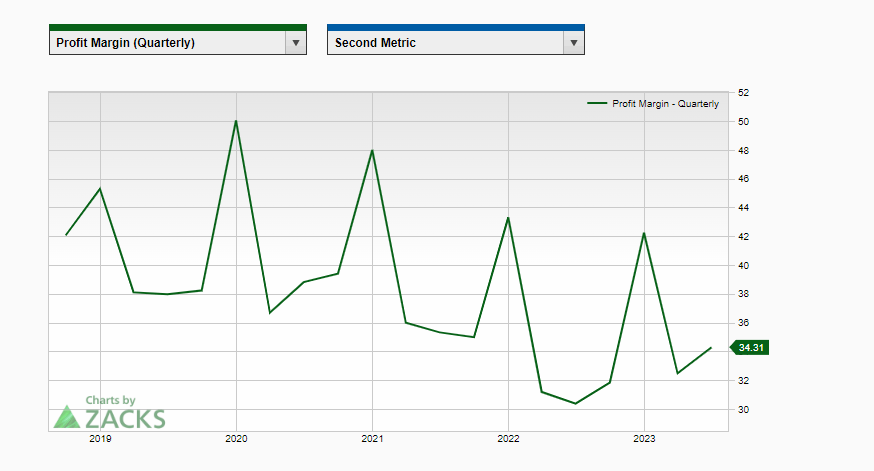
Currently, Check Point Software Technologies Ltd. (CHKP) has a profit margin of 35%, showing a strong recovery from the downturn in late 2022 and early 2023. This is a positive sign that the company is regaining its financial strength and is on track to match or even exceed its 2020 profit margins.
Indeed, as AI continues to evolve, the demand for robust cybersecurity systems is expected to increase. This could lead to higher revenues and profit margins for companies like Check Point Software Technologies, which specializes in providing such solutions.

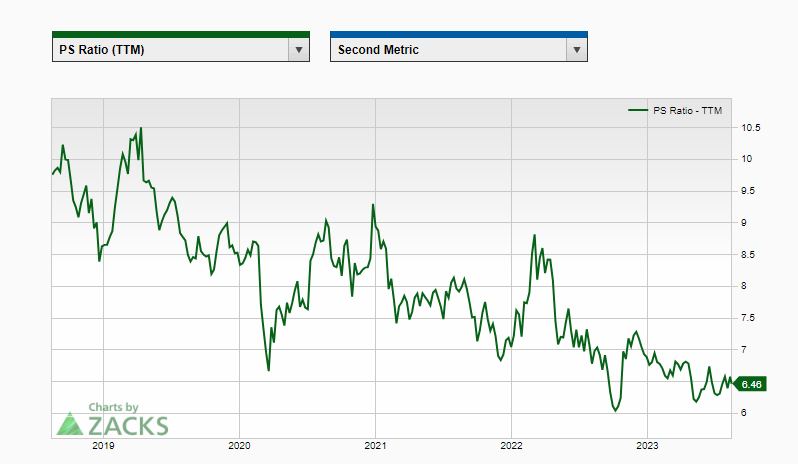
The Price-to-Sales (P/S) ratio for CHKP is currently at 6.7. CHKP’s price-to-sales (P/S) ratio presents a compelling proposition for investors. Notably, the stock maintains a healthy distance from overbought levels on the monthly charts, indicating a favourable entry point. Savvy investors can capitalize on market pullbacks to initiate new positions or augment existing ones. This approach gains further significance considering the stock’s highly appealing P/S ratio. By strategically aligning with pullbacks, investors can position themselves advantageously for potential gains while leveraging the advantageous valuation metrics of Check Point Software Technologies.
CHKP Stock Price Target for 2023 and Beyond
According to the weekly charts, CHKP is currently trading in the moderately overbought territory. Consequently, a prudent approach entails awaiting a pullback towards the 120 range before allocating fresh capital. However, adopting a long-term perspective reveals a promising outlook, considering the absence of overbought conditions on the monthly charts. Should a monthly closure materialize at or above 132, this could pave the way for a sequence of new highs. Tactical Investor Aug 15, 2023 Update
The above scenario materialized as the stock reached as high as 168 before retracing. The optimal setup now would entail consolidation, releasing significant pressure, and then trending sideways to gather momentum for the next upward movement. Ideally, it should dip to the 145 to 150 range, with the weekly charts entering oversold territory. At that point, it would be prudent to deploy funds gradually, dividing them into 3-4 lots. Deploy your funds one lot at a time as it approaches and potentially drops below the above-stated range.
Other Articles of Interest
List at Least One Factor That Contributed to the Stock Market Crash and the Great Depression


