


Market Sentiment Indicator: Trend Indicator is At the Top
Updated April 3, 2024
Market sentiment plays a crucial role in determining the direction of stock prices. As the legendary investor Benjamin Graham, known as the “Father of Value Investing,” once said, “In the short run, the market is a voting machine, but in the long run, it is a weighing machine.” This quote emphasizes the importance of understanding market sentiment in the short term while focusing on fundamental value in the long term.
Our goal is to determine the trend in advance of the event. To illustrate this point, let’s look at real-time examples of the trend indicator in action. Blue arrows indicate buy signals based on the trend indicator, and red arrows indicate sell signals. As you will see from the numerous examples below, we are not looking to spot the ultimate bottom or top. In most cases, the signal turned bullish before a base was in place and bearish before a top was in place.
One powerful tool for gauging market sentiment is the AAII Sentiment Survey, which measures the percentage of individual investors who are bullish, bearish, or neutral on the stock market for the next six months. As of December 28, 2023, the survey showed that 46.33% of investors were bullish, compared to 52.92% the previous week and 20.31% the last year. This level of bullishness is higher than the long-term average of 37.54%, suggesting that investors are currently optimistic about the market’s prospects.
Another important indicator is the CNN Fear & Greed Index, which analyzes seven factors to determine the level of fear or greed in the market. As of March 2024, the index shows that the market is currently in a state of “Greed,” scoring 75 out of 100. This high level of greed suggests that investors are becoming increasingly confident and may be more willing to take on risk.
However, it’s important to remember the words of Warren Buffett, widely considered one of the greatest investors of all time: “Be fearful when others are greedy, and greedy when others are fearful.” This contrarian approach has served Buffett well throughout his career, as he has often found undervalued opportunities when market sentiment is overly pessimistic.
Another top investor, George Soros, is known for his theory of reflexivity, which suggests that market sentiment can become a self-fulfilling prophecy. As he once said, “Markets are constantly in a state of uncertainty and flux, and money is made by discounting the obvious and betting on the unexpected.” By understanding market sentiment and positioning themselves accordingly, investors can potentially profit from shifts in market momentum.
In conclusion, while market sentiment can provide valuable insights into short-term market movements, it’s essential to maintain a long-term perspective and focus on fundamental value. As Peter Lynch, the legendary manager of the Magellan Fund at Fidelity Investments, once said, “Far more money has been lost by investors preparing for corrections, or trying to anticipate corrections than has been lost in corrections themselves.” By staying disciplined and sticking to a well-defined investment strategy, investors can navigate the ups and downs of market sentiment and achieve long-term success.
Market Sentiment Indicator: Not Trend Line Drawing
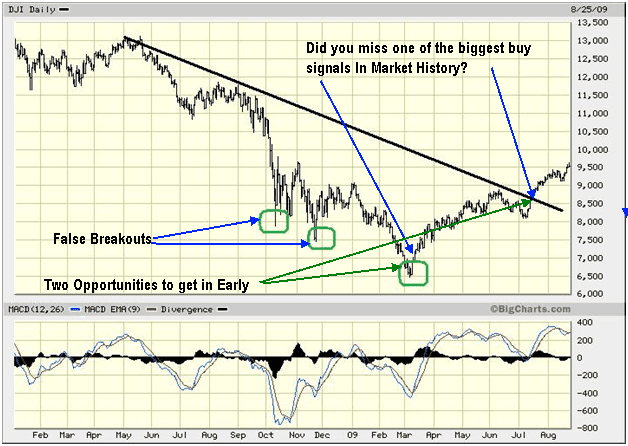
The trend indicator is not the same as Drawing Trend Lines. If you were applying the principles of trend line investing, you would have waited for SOHU to break out above the black downtrend line (the breakout point indicated by the green arrow). However, the trend indicator turned bullish almost three years earlier and generated additional buy signals, as shown by the blue arrows. The trend indicator allows you to lock in significantly larger profits while focusing on the current trend instead of trading based on news or wrong perceptions.

“In 2011, an opportunity presented itself with an entry point around $32, offering a favourable position compared to waiting until 2014 when entry occurred at approximately $39.00-$40.00. The new blue arrows indicated that the strategic advantage extended to the ability to augment the position. Seizing profits aligned with the red arrows and re-entering positions based on subsequent blue arrows proved a viable approach for short-term traders.
Notably, precision in timing the exact market bottom or top wasn’t the primary focus. This nuanced strategy doesn’t adhere to pinpoint entries and exits. Instead, the Tactical Investor’s objective centers on leveraging Market Sentiment Indicators, such as the Trend Indicator. The aim is to enter when markets are oversold, sentiments are apprehensive, and, conversely, exit when markets exhibit overenthusiasm.
Let’s take a look at two examples: SOHU and NTES.
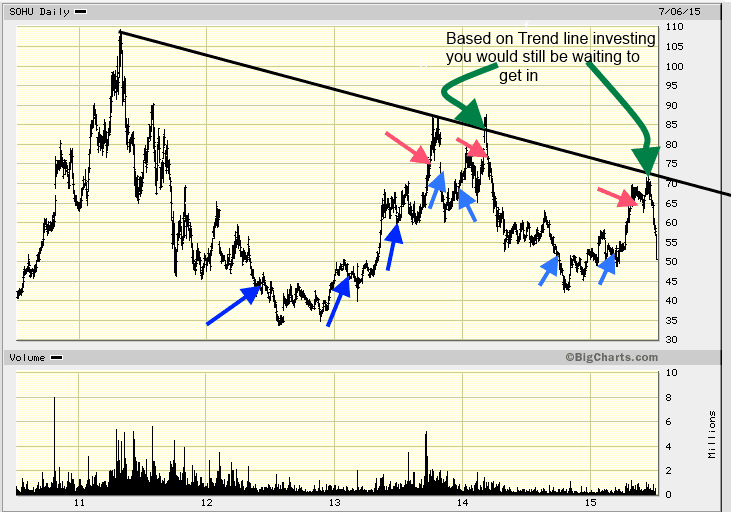
In early 2012, an opportunity arose to initiate a position in SOHU, followed by continuous additions until 2015. Profits were strategically taken at points indicated by the red arrows. For those adhering to the trend line investments protocol, patience remains paramount as the waiting game continues. Notably, the strategy seldom aims for precise entries at market bottoms or tops; that’s not the primary objective. The focus is on entering when markets show bottoming signals and exiting when signs of a market top emerge.
Once again, we emphasize that a Tactical Investor doesn’t strive for exact timing at the market’s zenith. Any fortuitous timing at the actual top is attributed to chance. Tactical Investing involves entering when the crowd disregards or dislikes an asset class and the given asset trades in highly oversold ranges.
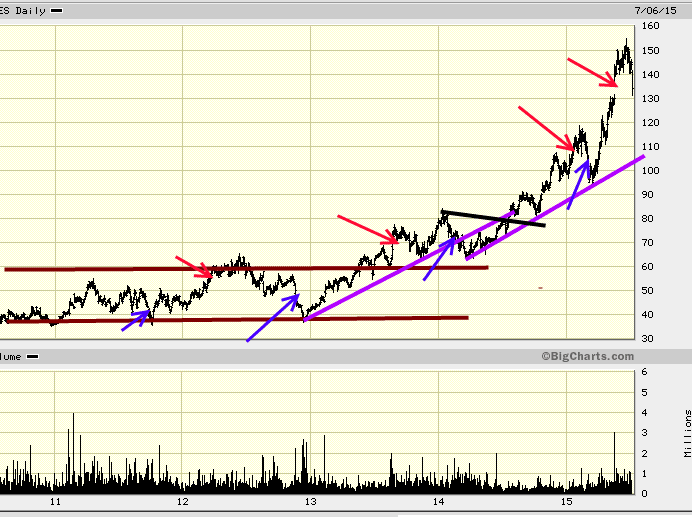
The first buy signal for the stock NTES was generated in late 2011, and you would have got in and out continuously till 2015; along the way, you would have profits as indicated by the red arrows. Again, we rarely got out towards the top or in towards the bottom, and that is perfectly okay with us.
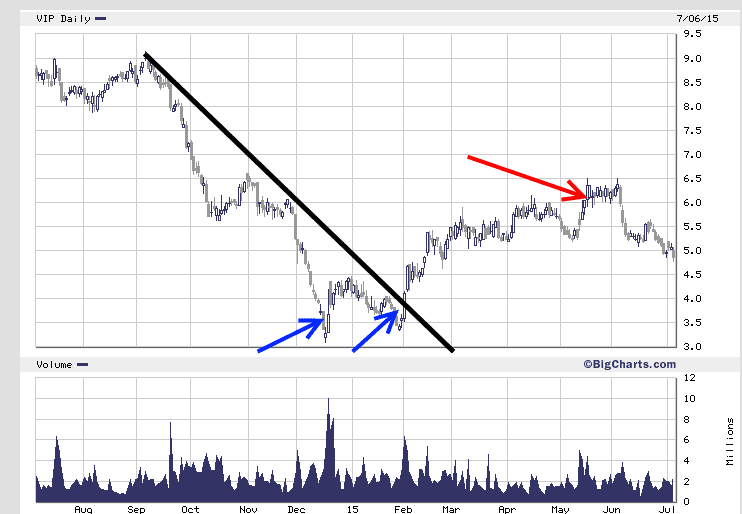
With Vimpel Communications (VIP), the first buy signal was triggered in November 2014, followed by a second and much stronger buy signal in February 2015. Shortly after that, the stock took off, and we bailed out around 6.30; while we managed to get close to the top, this was more luck than planning.
We aim to get in when the market starts to indicate a top. This usually means we get in early and out early, but we are not too worried about catching a few extra points. We aim to get in before the market takes off and out before it breaks down.
The Tactical Investor Trend Indicator: Ideal for Spotting Tops
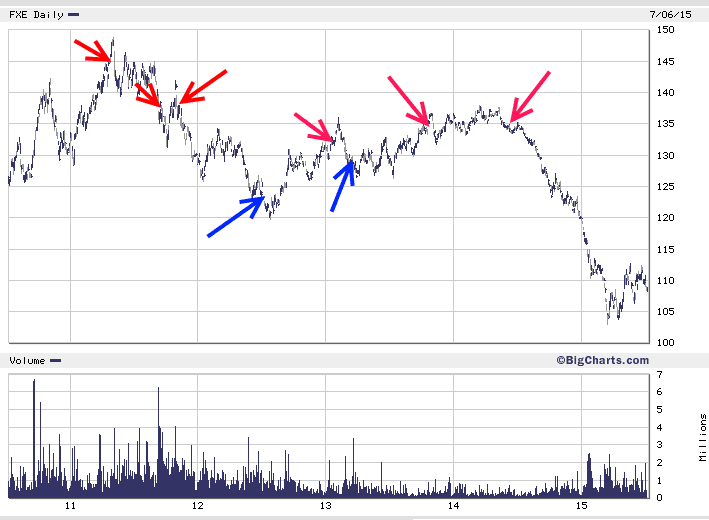
“The Tactical Trend Indicator proves effective in identifying opportune entry points and pinpointing topping actions. For instance, FXE, a Euro proxy, initiated sell signals in August 2011 and has consistently generated them. The strategy involved buying calls during the intervals marked by blue arrows. This dynamic approach provided ample opportunities for futures traders, equity players, and options enthusiasts to capitalize on the market’s downward movement, securing substantial profits.
Similar calls were made for Gold and the dollar in 2011. At that time, the strategy pivoted to a bullish stance on the dollar while adopting a bearish outlook on the Euro and Gold. Subscribers following these recommendations closed their positions in Silver Bullion (with profits exceeding 1000%), Gold Bullion (700% plus), and Palladium Bullion (approximately 800%). This underscores the Tactical Investor’s proficiency in navigating market trends for significant gains.”
“The Tactical Trend Indicator proved invaluable during the most substantial and controversial bull market in financial history. Its function doesn’t lie in precise market timing, a task often reserved for those with an appetite for pain and abundant time. Instead, this indicator focuses on navigating the market’s overall trend, ensuring that significant opportunities are not overlooked.
Despite notable volatility, especially after establishing the first position in 2009, any discomfort tends to be short-lived. Acclimating to the indicator’s operational nuances minimizes concern over short-term movements. Encountering a dip in the market after a buy signal triggers a proactive response – buying more. The mantra remains steadfast: as long as the trend is upward, more significant deviations present better buying opportunities.”
If you want more, look at the extensive list of our market calls.
Other Articles of Interest


Psychological Manipulation Tactics: Your Recognition & Defense Guide
