Notice a trend here; the herd always needs something to fret about. The media understands this, so they churn out bombastic stories. Without demand for this rubbish, the press would stop dishing it. Now that the COVID hysteria is tapering down, the masses need something new to focus on; the latest issue at hand is reflation. We all know that real inflation has been an issue for decades. The price of everything that matters (houses, education, food, rents, health insurance, medical, etc.) has been trending upwards. However, the basket of goods the Fed uses to determine inflation has been trending downwards.

And in the end, that is all that matters, for they will use this basket to determine future policies. The Fed is the Fox that controls the hen house, and it decides when it’s time to cull the broad/flock of chickens. The Fed is far more potent than most give them credit for. Their only function is to fleece the masses via boom-and-bust cycles, and the best/worst part is that they control these cycles to a T. We expect the reflation argument to die a horrid death.
![]()
One could argue that AI will create massive destruction in the above sectors in terms of significantly lower prices as the human element is replaced with the machine element. This will improve efficiency 100fold and eventually result in prices dropping as much as 90% from their peaks. The bottom line is that the reflation argument is a non-event when one takes the long-term outlook. Even if rates had to surge to the 3.5% range, it would be a short-lived event, and with the high interest rates in the ’80s, current rates are godsent.
We have nervous nellies/spoilt brats with nothing better to do than create projections of the next disaster-type event to add some colour to their otherwise miserable and or boring lives.
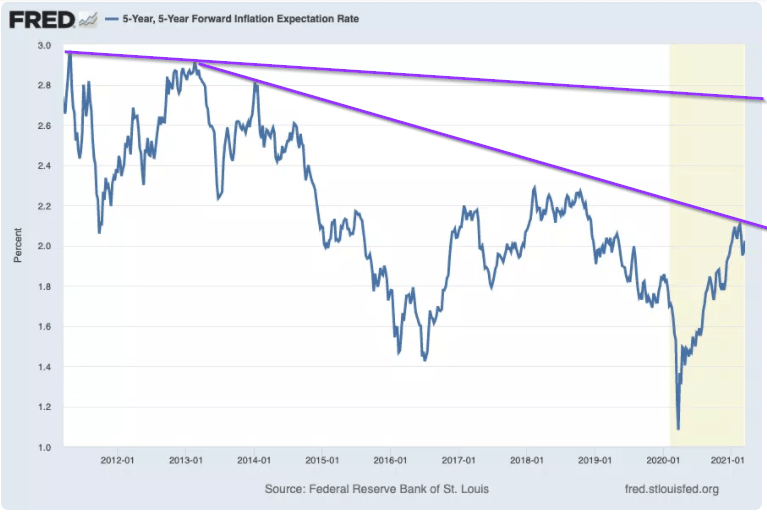
This long-term chart ends the pathetic inflation argument and once again proves that the masses are wired to lose when it comes to investing. Remember this: misery loves company, and stupidity demands it.
Looking at the monthly chart of TLT, the current pullback is entirely normal, and something like this took place from Nov 2016 to early 2019. Despite all the proclamations of doom, interest rates topped out, and bonds rallied. TLT is sitting on support now, but given the highly volatile nature of this market, it is possible that TLT could (focus on the word “could”) trade down to the 123 to 126 ranges with a possible overshoot to 120.
If this comes to pass, it would be a short-lived event and probably make for a long-term screaming buy. From a very long-term perspective, it is possible that TLT could rally to 210 ranges with a possible overshoot of 240.00