
Updated Aug, 2023
Writer: Aussie John
PLUNDER FROM DOWN UNDER
Part 1
Can you give an example of a stock that has given massive gains as you describe in the introduction?
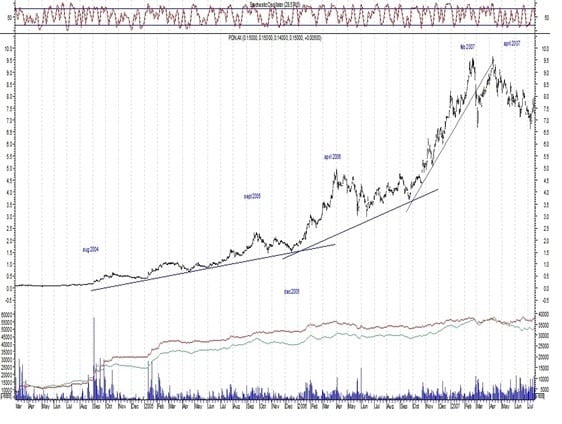
The chart below is of Paladin Resources. It is still listed with a productive uranium output but is not a current recommendation. We shall talk about this stock at another time when we discuss the all-important fundamental factors that made this stock such a huge success AT THAT TIME.

Plunder from Down Under Rules
How does the chart appear at the start?
The share price had flatlined for over 2 years fluctuating between 1- 2 cents. You DON’T want to have your capital tied up while this occurs. We try to get in at a time when there will be signs of a reasonable move up in the next 4 months. Note the increasing volume.
How often does this happen?
These are uncommon events even when the times are right. The stocks that can do this need to be carefully screened out, and even then some can fall by the way-side. However the risk-reward dynamic is so weighted to reward once we have used our scientific method, it is all worthwhile.
How do we know we are buying into strength?
1. The most useful thing is the chart pattern: rising price and volume. This is our screen to build a shortlist of potential stocks.
2. Directors increasing their interest.
3.The concentration of shares owned by the top 20 shareholders. This is the classic shift from “weak to strong hands”
4.Using the buy/sell spread
Here is the buy-sell spread that you will see on an electronic brokerage. It is not all the buyers and sellers by any means. There are day traders watching every tick, and those just looking who want to buy or sell depending on what is available. A minute before this snapshot was taken, a seller came on with a line of 500,00 at 0.034. This disappeared in the blink of a lid. There is a large buy order at 0.033 and if these buyers are not satisfied could push the price up to 0.04. It would take a lot of selling tp push the price down.
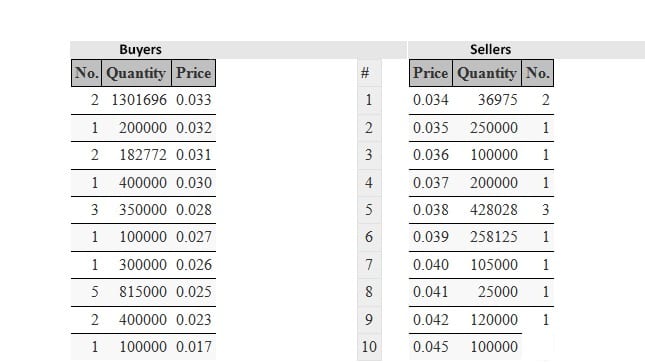
This is not only 1 way to recognize a strengthening market, but tells us a good way to buy in such a market: wait until a seller comes out and strike, just don’t stand in line and wait. Sure you might be filled, but in a stronger market, you’ll miss out. (and it is these type of stocks that we are entering so as to keep the time of holding down, from say 8 years of agony before the stock makes gains to 3 years of seeing gains)
4.you put in a buy order at say 0.033 and the price starts to move away from you.
5. Minimal change in the buy orders when the market goes down – or even the share price increases- although this usually occurs in the ascendant phase of the share price.
None of the above is absolute requirements. Even a strengthening stock may have quite days where large lines come onto sell. We can tell this from the chart pattern. No stock in the early stages goes straight up!
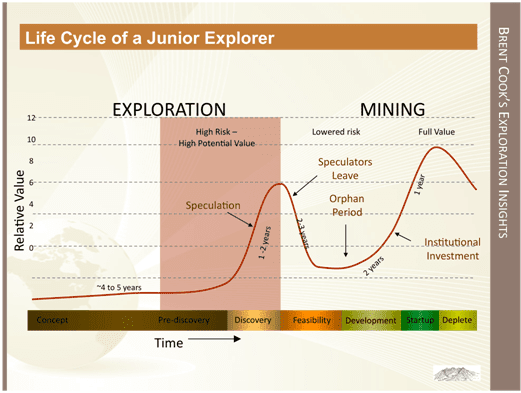
The chart below has been in several publications and summarizes the relationships between fundamentals and share prices for explorers transitioning to produces. As production becomes more certain, the risk criteria and capitalization starts to interest funds and institutions and the really big money starts to flow in……..we start to think about selling!
Late Addition
With the election of Donald Trump as the US President, I suspect that we could start to see a much more active market, and possibly a runaway market with commodity inflation as the US rebuilds, hence I am issuing 2 buy recommendations much sooner than I thought.
ERL.AX Empire Resources
The last trade was $A0.038 cents, buy up to 0.04c but do not chase or we could prematurely run up the share price. They are building an open-cut mine that is well leverage to the price of gold. Sol will have a recent release on his website.
AZS.AX Azure Minerals
There is a hill of silver in Mexico just begging to be mined! There are a lot of shares on issue and there is talk of consolidation before looking at a Canadian exchange listing.
The last trade was at $A 0.031 cents, buy up to 0.035
Sol will have a release available for you.
Please re-read the introduction to this series. Several more parts will be published soon.
P.S. you can look up the charts of these companies on yahoo finance by coding in the tickers. Don’t forget the .ax!
This content was originally published on Dec 12, 2016, but it has been continuously updated over the years, with the latest update conducted in Aug 2023.