
Stock Market Trend Graph 2012: Capitalize on the Dip, Cash Out on the Rip
Extracted from Jan 23, 2012 Market Update.
| Moving average | New Highs | New lows |
| 20day | 130 | 160 |
| 100 day | 660 | 60 |
| I year | 125 | 30 |
20-day moving average of new lows = 4615 (New all-time Record set on Sept 16th 2008).
1 year moving average of new highs = 10 (New all-time low set on Nov 25th 2008)
1-year moving average of new lows= 2225 (New all-time Record set on Sept 16, 2008)
The speed at which the moving averages of new highs and new lows are shifting is a glaring testament to the current volatility of the markets. It signals that we are approaching critical turning points, which our indicators already confirmed. March stands out as a pivotal timeframe to watch closely. This week, the moving averages of new highs surged again, but this rally is occurring on relatively low volume—an alarming intra-market negative divergence. Such divergence typically signals that the rally’s strength is unsustainable, hinting at potential weakness ahead.
The comparison of new highs to their moving averages from 2009 is even more telling. Over the past two years, especially in the last six months, the moving average of new highs has consistently underperformed. It’s currently about 75% lower than the 2009 peaks, which suggests a market more likely to consolidate or pull back, rather than race toward new highs. This weak performance is more indicative of a market needing correction, rather than one preparing for a breakout.
Cycles were forecasting a market top around the 18th-21st of this month. However, as always, price action is the ultimate validation of our predictions. For the analysis to be fully corroborated, the price action must confirm what the cycle and indicators suggest. Ideally, when price action and cycle analysis align, the market’s next move becomes much clearer. The key cycle to focus on, however, is the one slated for March—marking the three-year anniversary of the current bull market. Three-year cycles are historically significant as they often coincide with major market tops or bottoms. In this case, the pattern suggests that March may very well mark a top.
The BBC Global 30 Index combines markets from Europe, Asia, and North America—the three primary power centres of the global economy—offers a comprehensive view of global market activity. This index is approaching strong resistance in the 5800-5900 range. While the intermediate-term trend remains bullish, a pullback is likely before it rallies again. This mirrors our broader outlook for the market: expect a sharp pullback followed by a strong counter-rally, with March potentially marking a larger top. If this pattern unfolds as anticipated, the top in March could lead to a significant correction.
Finally, the VIX, trading dangerously close to its 52-week lows, signals an increasing sense of complacency among investors. The VIX is only truly useful when it reaches extreme points, precisely what we’re witnessing now. A near-term market complacency is brewing, historically preceding volatility or a sharp market shift.

The Herd Mentality: Late to the Rally
The “dumb money” is aggressively chasing this rally, but as history shows, the crowd is always late to the party. They pile into trends when momentum is at its peak, only to be left holding the bag when the inevitable correction hits. This late-stage behaviour drives short-term spikes in price, creating a volatile environment ripe for smart traders to capitalize on.
Riding the Waves of Volatility
Our V indicator continues to set new highs on a weekly basis, signalling that volatility will remain a key feature of the market moving forward. This surge in volatility explains why corrections tend to be sharp and brief—sometimes occurring so quickly that it feels like there was no correction at all. Volatility, however, should not be feared. When used wisely, it presents traders with opportunities that would otherwise be unavailable in more stable markets. The trick is to stay ahead of the moves, not be blindsided by them.
Smart Trading with Price Targets
To navigate these volatile waters, we’ve devised a solution: issuing price targets in advance. By doing so, we equip our subscribers with clear entry and exit points, removing the guesswork and providing a sense of control even amidst the chaos. This foresight is key to managing risk, ensuring traders don’t panic during sharp moves and can act decisively when the time comes.
Warning Signs from Smart Money Indicators
Despite the rally, our smart money indicator refuses to validate the current price action. This divergence is a red flag, indicating that while the market could trend higher in the short term, the likelihood of a strong, sudden correction is alarmingly high. The smart money indicator has never been wrong on long-term time frames, and its current stance suggests caution. Traders must remain alert to the possibility of an abrupt pullback as the market’s strength might not be sustainable.
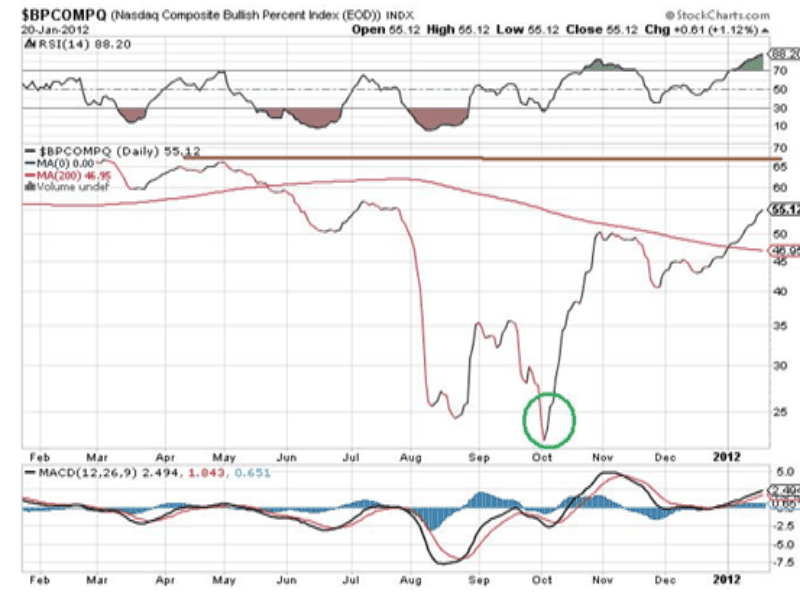
Contrarian Indicator: The Overbought Signal
This contrarian indicator serves as a vital warning when the market is trading in overbought territory, as it is now. When the index reaches these levels, traders must exercise caution before opening long positions. Conversely, when the index is in the oversold range, it signals potential buying opportunities. Understanding these dynamics is crucial for navigating the market’s peaks and valleys.
Maximizing Accuracy with Complementary Indicators
The true power of this contrarian indicator is unlocked when used alongside other tools like the VIX, V indicator, and similar metrics. The index can provide valuable insights, but combining it with other market signals enhances its reliability and precision. For example, just like the VIX, this indicator becomes particularly meaningful when it’s in extreme zones. The October 2011 market action is a prime illustration of how extreme readings from these indicators can signal major shifts, allowing traders to anticipate key turning points.
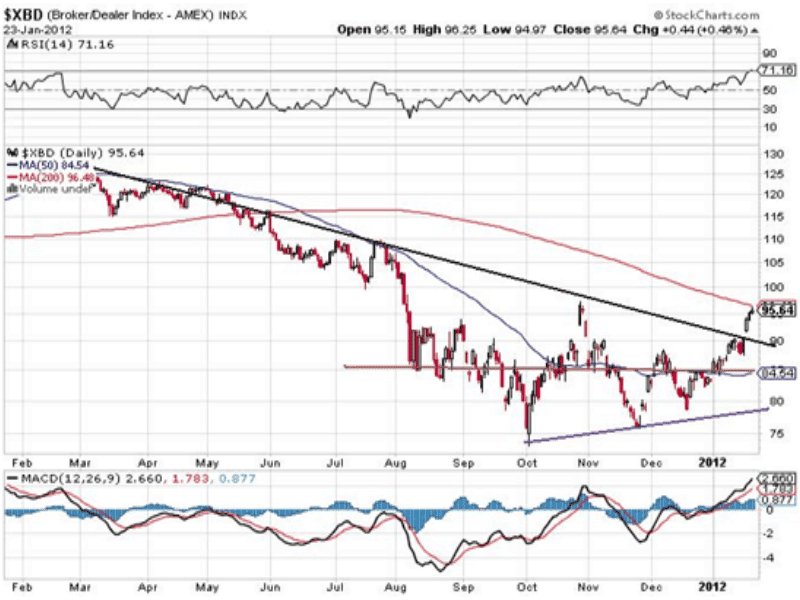
Supporting Mid-Term Bullish Indicators: The Calm Before the Storm
This index aligns with our mid-term indicators, which remain bullish. However, the indicators continue to suggest a short and sharp correction is likely before a strong counter-rally takes hold. As a contrarian tool, this index is trading well off its highs, signalling that the market is losing some of its upward momentum. Volume continues to dwindle as the market trends higher, a classic sign of weakening conviction. Meanwhile, speculators are ramping up their risk exposure, evident from the surge in odd lot trading and options activity. These are clear markers of market complacency creeping in, a potentially dangerous situation for those who fail to take caution.
Time to Exit: The Price Targets Are Within Reach
Aggressive traders who took this advice should now be looking to get out of their long positions. As stated earlier the SPX traded as high as 1297, which is just a few points away from our 1305, the lower end of our suggested targets. Jan 16, 2012 market update.
Aggressive traders who followed our advice should now position themselves to exit their long positions. The SPX recently traded as high as 1297, just a few points shy of our 1305 target, the lower end of our suggested price range. As we previously indicated in our January 16, 2012, market update, this marks the point where traders should start locking in gains. It’s crucial for traders to take action now, either by exiting entirely or closing out remaining long positions immediately, as further upside from here may be limited and a correction looms on the horizon—time to act before the market shifts.

Conclusion: Analyzing the Current Market Dynamics
The SPX has now traded as high as 1322, just 3 points shy of the upper end of our projected target range (1305-1325). It’s important to note that markets often tend to overshoot, so there’s still a possibility of a brief spike to the 1335-1345 range on an intraday basis. However, this doesn’t significantly change the overarching trend—we’re still seeing a market nearing its short-term peak.
The rally has stretched longer than initially anticipated in terms of time, although not necessarily in price movement, which has slightly altered the timing of our predictions. Despite this extension, the underlying pattern remains intact. As such, this correction is now expected to be less severe than originally projected. We are now adjusting our SPX targets to the 1240-1250 range, with a reasonable chance of testing the 1200 levels. If either of these targets is reached, it will provide substantial opportunities for returns, particularly with the put options we have already acquired.
While multiple smaller cycles converge, the March cycle is the most critical to focus on. This cycle suggests that a more significant correction could materialize, setting the stage for a powerful counter-rally. In the meantime, the intermediate trend remains bullish, reaffirming that once this pullback has played out, the market is likely to rebound strongly.
As SPX has traded within our suggested ranges, traders who have followed our guidance should have closed all remaining long positions in their portfolios, except PAL.