
Dow 30 Stocks and the Dow Jones Industrial Average (DJIA)?
Updated March 31, 2024
The Dow Jones Industrial Average (DJIA), often called “the Dow,” is a stock market index that tracks the performance of 30 large, publicly owned companies listed on the New York Stock Exchange and the Nasdaq. Charles Dow created the index in 1896 to serve as a proxy for the broader U.S. economy.
The Dow is the second-oldest U.S. market index after the Dow Jones Transportation Average. It is a price-weighted index, meaning higher-priced stocks significantly impact the Dow’s value more than lower-priced ones. A committee chooses the 30 component companies, which are well-known, mature companies with leading market positions.
How the Dow Differs from Other Major Indices
The Dow tracks 30 large-cap stocks, while the S&P 500 tracks the 500 most extensive U.S. stocks. The Dow is price-weighted, while the S&P 500 is market-cap-weighted. Over the long run, the Dow and S&P 500 have had similar performance, with the S&P 500 averaging a 10.05% annual total return over the 20 years ended Aug. 10, 2023, compared to 9.57% for the Dow.
The Nasdaq 100 Index aggregates 100 of the most extensive non-financial stocks traded on the Nasdaq Stock Market. In 1932, the Dow expanded beyond industrial stocks to better reflect the broader market, adding companies like Coca-Cola and Procter & Gamble which remain components today.
Dow Milestones and Changes
The Dow hit an all-time high of 39,282.28 points in intraday trading on Feb. 23, 2024. In 2021, it climbed above 31,000, 34,000, 35,000 and 36,000 points for the first time. The index initially contained just 12 companies in 1896, expanded to 20 in 1916, and reached its current 30 components in 1928.
There is no set schedule, but the Dow is periodically updated by S&P Dow Jones Indices to reflect shifts in the economy. For example, Apple, Microsoft and Intel were added in 1999 as the tech sector grew. Energy giant ExxonMobil was dropped in 2020 after 92 years. The most recent change in 2023 was Amazon replacing Walgreens.
So, in summary, the Dow Jones Industrial Average remains a key benchmark of overall U.S. stock market performance despite some limitations as a price-weighted index of just 30 companies. Its components aim to represent market leaders across the economy.
Tactical Investor Dogs Of the Dow Theory
The Tactical Investor Dogs of the Dow Theory is a unique approach to the traditional Dow strategy. This theory focuses on two main factors: the trend of the stock and the risk-to-reward ratio.
The first factor to consider is the stock trend. If the trend is positive (bullish), it indicates that the stock’s price is likely to increase. This is a good sign for investors as it suggests profit potential.
The second factor is whether the stock trades in the monthly charts’ remarkably or insanely oversold ranges. When a stock is oversold, it has been aggressively sold, and its price has fallen. This could indicate a buying opportunity as the stock may be undervalued and could rebound.
Another crucial factor in this theory is the risk-to-reward ratio. This ratio compares a trade’s potential loss (risk) with its potential profit (reward). A favourable risk-to-reward ratio means the potential reward outweighs the risk, making the trade more attractive.
While the traditional Dogs of the Dow strategy focuses on the ten highest-dividend-yielding stocks, the Tactical Investor Dogs of the Dow Theory does not consider the dividend factor. If a stock pays a high dividend, it’s regarded as a bonus, but it’s not a requirement or a deciding factor in this strategy.
The Tactical Investor Dogs of the Dow Theory offers a different approach to the traditional Dow strategy. This theory aims to identify the best possible investment opportunities, regardless of the dividend yield, by focusing on a stock’s trend, oversold status, and risk-to-reward ratio. This approach aligns with the idea of being objective, rational, and sound, and different from the policy followed by most investors.
Understanding Risk in Shorter Timelines
The concept of “the shorter the timeline, the higher the risk factor” is a common understanding in trading and investment. This is because shorter timelines often involve more volatility and less predictability. **Volatility** is a statistical measure of the dispersion of returns for a given security or market index, and it can significantly impact short-term trading.
Many traders may feel compelled to focus on shorter timelines, believing they can capitalize on quick market movements. However, this approach can lead to increased stress and sleepless nights. The constant need to monitor the market and make quick decisions can be mentally and emotionally draining.
On the other hand, focusing on longer timelines, such as weekly charts, can provide a more comprehensive view of market trends. Each bar in a weekly chart represents one week’s worth of data, offering a broader perspective on market movements. This approach can be less stressful as it doesn’t require constant monitoring and quick decision-making.
Some stocks are highly volatile, meaning their prices can fluctuate dramatically quickly. When the weekly chart issues a sell signal, these stocks can shed up to 30% from their highs before rebounding strongly. Traders can use these charts to identify opportunities to jump in and out of stock or use a sharp pullback to open additional long positions, provided the risk-to-reward factor is in their favour.
While shorter timelines can offer opportunities for quick gains, they also come with higher risk and stress. Longer timelines, such as weekly charts, can provide a more balanced approach to trading, allowing for careful analysis of market trends and more strategic decision-making. As always, it’s crucial to consider the risk-to-reward factor when making any trading decisions.
Strategic Selection: NKE and DIS as Promising Dow Prospects for 2024
Dow contenders for the upcoming year, Nike (NKE) and Disney (DIS), emerge as noteworthy candidates. Observing the market landscape, a prudent approach involves biding time until 2024, allowing the markets to release some steam. Post-cooldown, consider adopting a gradual investment strategy, with both NKE and DIS showcasing potential as sound additions to a diversified portfolio. The careful selection of these stocks aligns with a strategic outlook, combining patience with an opportunistic approach for sustained growth.
Examining our topic through a historical lens serves two essential purposes. Firstly, it teaches us from the past to avoid repeating mistakes. Secondly, it reveals how our strategies translate into action over time, showcasing our ability to talk and walk in the ever-changing financial landscape.
Historical examples of Tactical Investor Dow 30 Plays
NKE
One could have opened positions from April to late July 2017 and sold roughly in October 2018. The idea is not to try to time the exact bottom or sell at the very top but to get in when the stock trades in the extremely oversold range and to sell when it moves to the highly overbought range. One could have gotten into the 50 to 55 range and closed the position in the 73 to 76 range for a gain of roughly 41% if we take the midway point on the entry and exit prices.
Even 35% is an excellent gain, considering the average yield on the Dow’s dogs for the past 20 years has been 10.8%. NKE is moving into the buy zone again.
PG
Long positions could have been opened from September to November 2018 in the 73 to 78 range. Positions could have been closed out in the 118 to 122 dollars for an average gain of 58%, holding time of roughly 12 months.
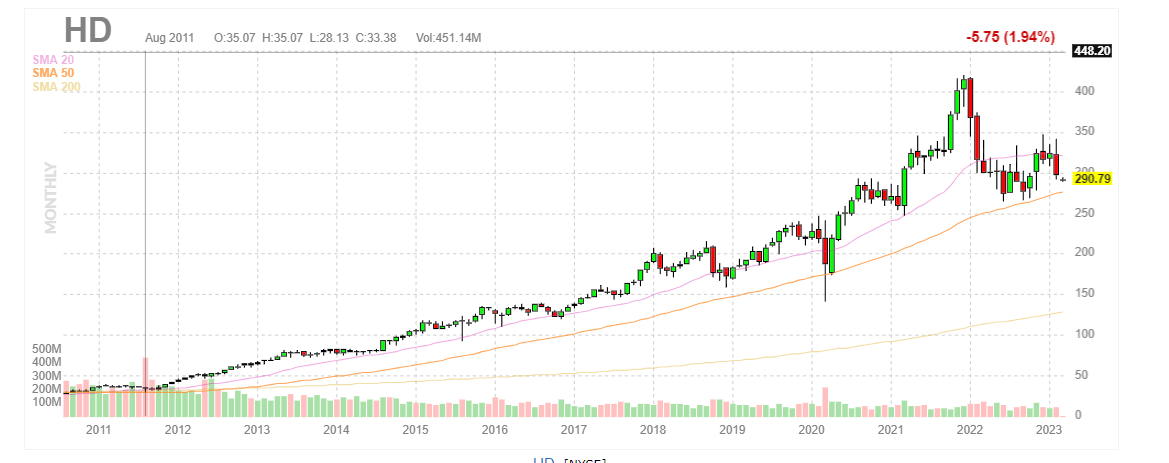
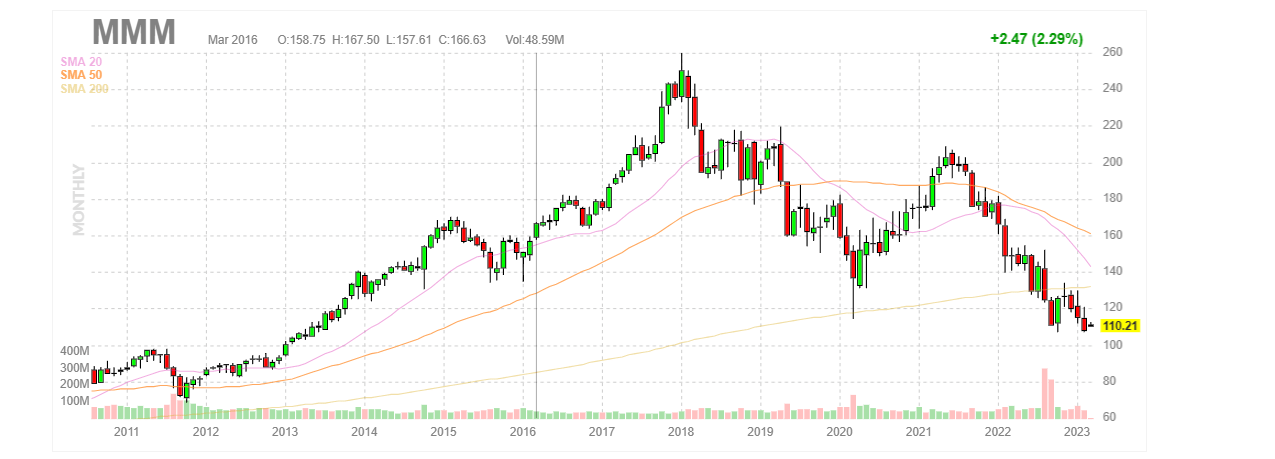
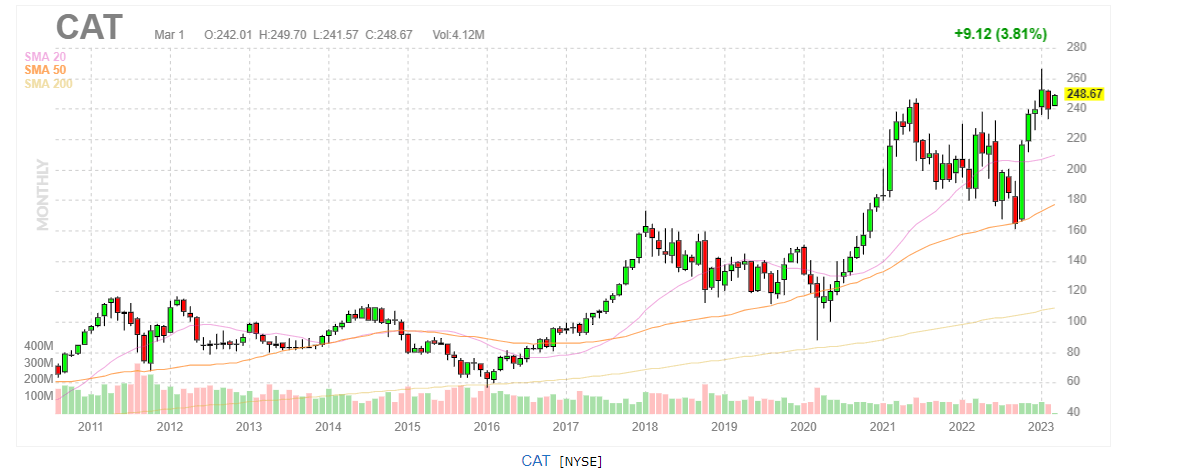
Good Dow 30 Stocks to Consider March 2023 Update
The following three stocks make sense: HD, MMM and CAT.
Overview of Investing in the Dow 30 stocks
Investing in the Dow 30 stocks, also known as the Dow Jones Industrial Average, can be brilliant for investors looking for stable, long-term growth. The Dow 30, also known as the Dow Jones Industrial Average, is a collection of 30 large-cap stocks considered blue-chip companies. These companies are leaders in their respective industries and have solid financial stability and growth histories.
One of the benefits of investing in the Dow 30 is its diversification. The Dow 30 comprises companies from various industries, including healthcare, technology, finance, and energy. This diversification can help reduce an investor’s portfolio’s overall risk. In addition, the Dow 30 stocks are often viewed as a barometer of the overall stock market, making them a good indicator of market trends.
Another benefit of investing in the Dow 30 is its long-term track record of growth. Over the past century, the Dow 30 has delivered an average annual return of around 5-6%. While this may not seem like an impressive return, it is essential to remember that the Dow 30 is a long-term investment. Over time, the compounding effect of these returns can add up to significant wealth accumulation.
Investors can also benefit from the dividends many Dow 30 companies paid. These dividends can provide a steady income stream for investors, and many of the companies in the Dow 30 have a history of increasing their dividend payouts over time.
Risks of investing in the Dow 30 Stocks
Despite the benefits, investing in the Dow 30 does come with some risks. Like all investments, there is the potential for market volatility and losses. Investors should also know the concentration risk of investing in just 30 companies. Additionally, while the Dow 30 may be a good indicator of overall market trends, it does not always represent the entire stock market.
Investing in the Dow 30 stocks can provide diversification, long-term growth, and a steady income stream through dividends. However, investors should consider their investment goals, risk tolerance, and horizon before investing in the Dow 30. With careful consideration and a long-term perspective, investing in the Dow 30 can be wise for investors seeking stable, long-term growth.
Small Dogs Vs Big Dogs of the Dow
The Small Dogs of the Dow theory is a variation of the Dogs of the Dow investment strategy, which involves investing in the ten highest-yielding stocks in the Dow Jones Industrial Average (DJIA). However, the Small Dogs of the Dow theory invests in the five lowest-priced stocks rather than the ten highest-yielding ones. While both strategies aim to provide higher returns than the DJIA, evidence suggests that the Small Dogs of the Dow theory may be a better investment strategy.
One study conducted by Investopedia compared the performance of the Dogs of the Dow strategy and the Small Dogs of the Dow strategy from 2001 to 2019. The study found that the Small Dogs of the Dow strategy outperformed the Dogs of the Dow strategy, with an average annual return of 9.9% compared to 8.6%. The study also found that the Small Dogs of the Dow strategy had lower volatility than those of the Dow strategy, with a standard deviation of 12.3% compared to 13.7%.
Another study conducted by Investopedia looked at the performance of the Dogs of the Dow strategy, the Small Dogs of the Dow strategy, and the DJIA from 1992 to 2017. The study found that the Small Dogs of the Dow strategy had the highest average annual return, at 13.2%, compared to 10.4% for the Dogs of the Dow strategy and 9.4% for the DJIA.
Delve into Captivating Chronicles
Media Manipulation; The Fraudulent Economic Recovery
Shanghai se Composite Index & The Margin Trading Story
Federal Reserve existence based on Fraud
Share Buybacks Deception- Corporate Share Buybacks Keeping Dow Bull Alive
The US Debt Dilemma: Navigating the Financial Storm
US Congress losing mind over Russian Arms Sales to Iran
Russia and China Gold Reserves Are Surging
Fed Head Will Shock Markets; Expect Monstrous rally
In The Midst of Chaos There is Opportunity
Central Bankers World Wide embrace race to the Bottom
Currency Wars & Negative Rates Equate To Next Global Crisis
Control Group Psychology: Stock Crash of 2016 Equates To Opportunity
Erratic Behaviour Meaning:Dow likely to test 2015 lows
Little Bird’s Trading Plan To Wealth
The Smart Investor IS buying While The Dumb Money selling
Psychological Manipulation Tactics: Your Recognition & Defense Guide
