
Using the Dow Jones Utility Average as a Timing Indicator for the Stock Market
Updated Dec 04, 2023
The Dow Jones Utility Average (DJUA) is a stock market index that tracks the performance of 15 utility companies listed on the New York Stock Exchange (NYSE). These companies provide essential services such as electricity, gas, and water. Their revenues and profits tend to be stable and predictable, making them attractive investments for conservative investors. The DJUA is often used as a benchmark for the performance of utility stocks.
The Tactical Investor theory suggests that the DJUA can be a timing indicator for the broader stock market. According to this theory, the DJUA tends to lead the way up and down, meaning that its movements can be used to predict changes in the overall Market. When the DJUA rises, it can be a sign that the market is about to experience a period of growth. At the same time, a decline in the DJUA may indicate that the Market is entering a period of decline.
Dow Jones Utility Average: What Insights Can It Offer
The Dow Jones Utility Average can offer insights into market trends and potential signals for investors. Traditionally, the utility sector is considered a defensive sector and is known for its stability and reliable dividend payments. As such, fluctuations in the Dow Jones Utility Average can provide indications of market sentiment and risk appetite.
The upward Dow Jones Utility Average may suggest a more cautious and risk-averse market sentiment. Investors tend to allocate their funds towards utility stocks during uncertain or volatile market conditions, seeking stability and income generation. Conversely, a downward trend in the Dow Jones Utility Average may indicate a more optimistic market sentiment, with investors willing to take on higher-risk investments.
The Dow Jones Utility Average can provide insights into interest rate expectations. Utility stocks are often sensitive to changes in interest rates due to their capital-intensive nature and reliance on borrowing. When interest rates are expected to decline or remain low, utility stocks may become more attractive to investors seeking higher dividend yields. Conversely, rising interest rates may lead to a decrease in utility stock prices.
Monitoring the Dow Jones Utility Average can give investors insights into market sentiment, risk appetite, and interest rate expectations, which can help inform their investment decisions.
To gain deeper insights into our utilization of the Dow Utilities for the conclusion above, consult the Tactical Investor Alternative Dow Theory. Explore the nuances and dynamics at play.
https://tacticalinvestor.com/alternative-dow-theory/
https://tacticalinvestor.com/dow-theory-no-longer-relevant-better-alternative-exists/
DJUA: Unleashing Opportunities with Contrarian Wisdom.
Using the DJUA as a contrarian indicator can enable investors to exploit market overreactions and uncover opportunities others may have missed. For instance, if the DJUA reaches its peak before the broader market, it could be interpreted as a signal to reduce exposure and wait for the market to experience a correction before making new investments.
When combined with mass psychology and technical analysis, the DJUA can be a powerful tool for investors. By understanding the power of groupthink psychology and avoiding the herd mentality, investors can potentially identify opportunities for long-term growth. Technical analysis can be used to identify trends and support and resistance levels in the market.
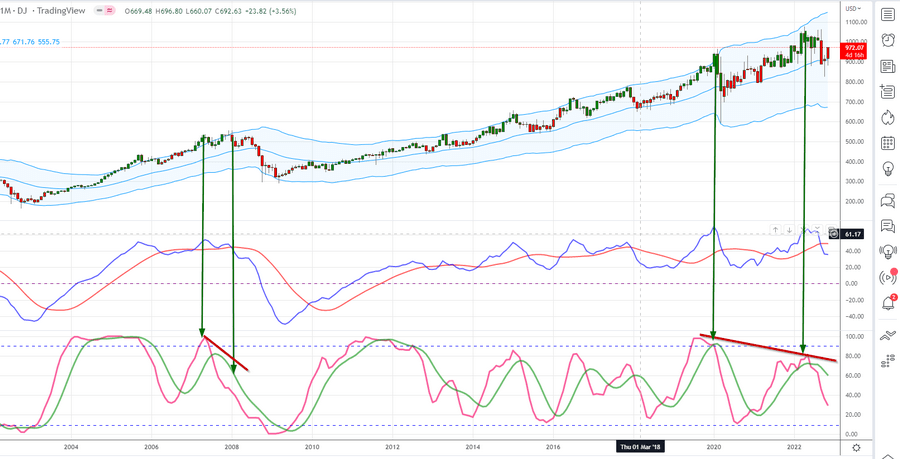
Source:tradingview.com
The above chart supports that the markets are headed for one more corrective wave based on historical patterns. We advised our clients to be prepared for solid waves of volatility, and this outlook came true. We also stated that the markets would likely rally firmly well into 2023.
Is the Dow Jones Utility Average a Reliable Market Tops and Bottoms Indicator?
Using the Dow Jones Utility Average as an indicator of market tops and bottoms can be illustrated with some examples. Let’s consider a hypothetical scenario:
The Dow Jones Utility Average shows a consistent upward trend during economic uncertainty, where investors are concerned about market volatility and potential downturns. Utility stocks, known for their stability and reliable dividends, attract increased investor interest as they seek safer investments. This increased demand for utility stocks can be seen as a signal that the broader market may be reaching the top or experiencing a correction. Investors interpret this as a reflection of risk aversion and a desire to protect capital.
Conversely, during economic recovery and market optimism, the Dow Jones Utility Average underperforms or shows a downward trend. This could indicate that investors are shifting their focus towards more growth-oriented sectors, such as technology or consumer discretionary stocks, which exhibit more robust performance during bullish phases. In this scenario, the relative weakness of utility stocks may be interpreted as a signal that the broader market is reaching a bottom or entering a bullish phase.
It’s important to note that while the Dow Jones Utility Average can provide valuable insights, it should be used in conjunction with other indicators and analysis methods. Various factors, including economic conditions, geopolitical events, and investor sentiment, influence market tops and bottoms. Therefore, relying solely on the Dow Jones Utility Average may not provide a complete picture of the overall market dynamics.
To make well-informed investment decisions, investors should consider a comprehensive approach that combines multiple indicators, fundamental analysis of individual stocks, and an understanding of broader market trends. Consulting with financial professionals and conducting thorough research can also help evaluate market tops and bottoms more accurately and reduce potential risks.
Dow Utilities and Stock Market Outlook: Nov 2023 update
They have generated a substantial positive divergence signal on the weekly charts. While this is not as powerful as a positive divergence signal on the monthly charts, all sharp pullbacks should be embraced until one of the following occurs.
- Until the trend changes, this usually won’t occur for several weeks in a row. Looking at historical records, the intermediate trend is unlikely to change for at least six weeks.
- IDU surges to the 86 to 90 range, or DJU rushes to the 990 to 1002 range; at that point, the situation would need to be re-examined to determine if the pattern on the monthly charts changed. The odds of the way changing are relatively low as the Dow Utilities are trading in the highly oversold zone on the monthly charts, as evidenced by the monthly chart below.
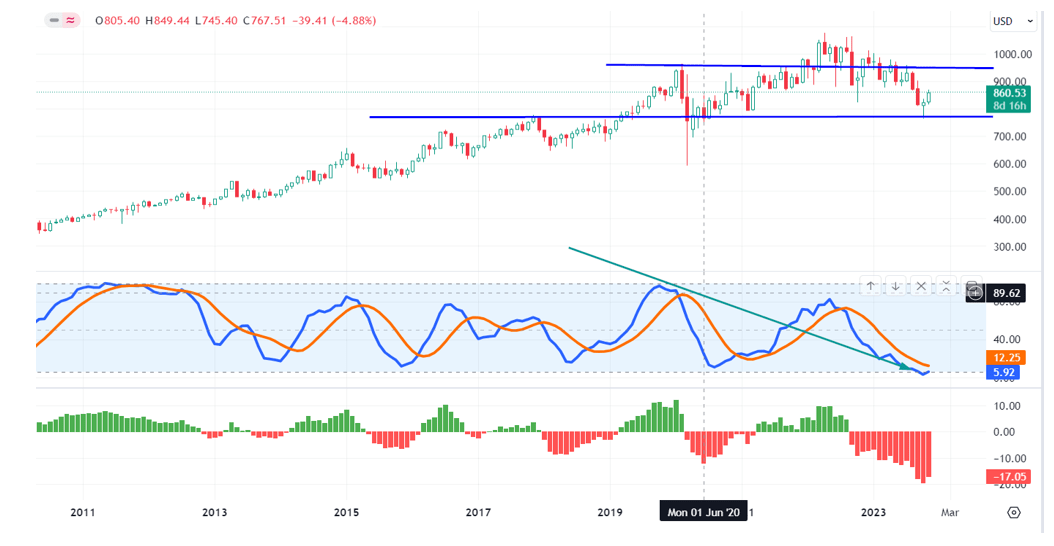
Dow Utilities should exhibit outstanding performance after generating a positive divergence signal. This, in turn, could catalyze the broader market, particularly undervalued sectors. It’s a strategic shift from the dominant tech giants to exploring overlooked opportunities. Overall, as of Nov 2023, the prevailing path appears upward.
Incorporating Technical Analysis (TA) with a pivotal focus on “combining” and intertwining it with the profound insights of Mass Psychology creates an unparalleled and robust strategy. Although short to mid-term market fluctuations spanning 6 to 20 months may seem notable, their significance fades compared to the enduring effectiveness demonstrated by Mass Psychology over decades of observation.
This harmonious fusion of TA and Mass Psychology empowers investors and analysts to leverage historical wisdom while navigating the present complexities. By adopting a Mass Psychology-rooted long-term perspective, one gains a profound understanding of market behaviour, enabling more informed and confident decision-making that transcends momentary market noise.
In essence, the skilful blending of these potent disciplines offers a masterful approach to comprehending and engaging with financial markets, leading to superior outcomes and strategic advantages for those who embrace it. With this time-tested and refined strategy, you can navigate the ever-evolving economic landscape with renewed assurance and conviction.
FAQs
Q: What is the Dow Jones Utility Average (DJUA)?
A: The Dow Jones Utility Average (DJUA) is a stock market index that tracks the performance of 15 utility companies listed on the New York Stock Exchange (NYSE). These companies provide essential services such as electricity, gas, and water.
Q: How is the DJUA used as a timing indicator for the stock market?
A: The Tactical Investor theory suggests that the DJUA can be a timing indicator for the broader stock market. According to this theory, the DJUA tends to lead the way up and down, meaning that its movements can be used to predict changes in the overall market. When the DJUA is rising, it can be a sign that the market is about to experience a period of growth. At the same time, a decline in the DJUA may indicate that the market is entering a period of decline.
Q: How can investors use the DJUA as a contrarian indicator?
A: Using the DJUA as a contrarian indicator can enable investors to exploit market overreactions and uncover opportunities others may have missed. For instance, if the DJUA reaches its peak before the broader market, it could be interpreted as a signal to reduce exposure and wait for the market to experience a correction before making new investments.
Q: How can the DJUA be combined with mass psychology and technical analysis?
A: By understanding the power of group think psychology and avoiding the herd mentality, investors can potentially identify opportunities for long-term growth. Technical analysis can identify trends and support and resistance levels in the market.
Q: Are there any articles that support the assertion that the DJUA can be a good indicator for investors?
A: Yes, articles such as “DJIA 101: How Does the Dow Jones Work?” on Investopedia and “Dow Jones Utility Average Methodology” on S&P Global support the assertion that the DJUA can be a good indicator for investors.
Q: What is the Tactical Investor Alternative Dow theory?
A: The Tactical Investor Alternative Dow theory is a theory that suggests that the DJUA can be used as a timing indicator for the broader stock market. According to this theory, the DJUA tends to lead the way up and down, meaning that its movements can be used to predict changes in the overall market.
Q: What insights can the Dow Jones Utility Average offer?
A: The DJUA can offer insights into the performance of utility stocks and can be used as a timing indicator for the broader stock market. It can also be used as a contrarian indicator and combined with mass psychology and technical analysis to identify opportunities for long-term growth potentially.
Other Articles of Interest

What Causes Mob Mentality: Unraveling the Psychology

Cracking Market Cycle Psychology: Navigating the Ups and Downs

Best Silver ETFs: Shining Bright in Your Investment Portfolio

Harnessing the Psychology of a Market Cycle: Thrive in Bull and Bear Markets

ETF Definition: A beginner’s guide to exchange-traded funds

What is a Bull Market Simple Definition: Understanding the Basics of a Thriving Market

Home Mortgage Interest Rates Forecast: Timing is Key

Why is investing in a mutual fund less risky than investing in a particular company’s stock?

Breaking Free: Embracing Early Extreme Retirement

What is a Bull Market? Unleashing its Power

Elliot Wave Theory: Navigating the Pitfalls

AI Takeover Theory: Humanity’s Crossroads with AI’s Future Impact

Financial Freedom vs Financial Independence: Your Wake-Up Call to Take Control

Embracing Contrarian Wisdom: How to Start Investing for Your Child