


Bank Stocks: A Golden Opportunity
Updated Oct 2023
A sign on the door of Opportunity reads Push.
Anonymous
In the world of finance, opportunities often come disguised as challenges. The recent market sell-off in August has led to a significant pullback in the financial sector, particularly in bank stocks. While many are fixated on the Fed’s potential 0.25% interest rate hike, the contrarian investor might see this as a golden opportunity to invest in bank stocks. One way to capitalize on this opportunity is through the KBW Nasdaq Bank Index (BKN), which provides exposure to various banking institutions.
Citibank and Deutsche Bank: A Case Study
Many analysts point to Citibank and Deutsche Bank still trading well below their pre-2008 highs as a sign of impending market doom. While it’s true that these banks are trading below their 2008 highs, it’s important to remember that the same could have been said for the NASDAQ after the dot-com bubble burst. Yet, the NASDAQ eventually tested its old highs, albeit after a considerable time.
Looking at a long-term chart from 1999 to the present, we see that the trend was generally upward after the correction ended in 2003. During this period, many stocks, such as Priceline (PCLN) and Amazon (AMZN), raced to new highs even as the NASDAQ slowly trended upwards. This serves as a reminder that naysayers will always find something to worry about, but that doesn’t mean that opportunities don’t exist.
While it’s important to seize opportunities when they arise, it’s equally important to exercise prudence. Investing in bank stocks, like any investment, carries risk. It’s crucial to conduct thorough research, understand the risks involved, and make informed decisions.
The Future of Bank Stocks
The future of bank stocks is not set in stone. The financial industry constantly adapts to new strategies and changes in the economic landscape. For instance, in response to the recent market conditions, the Fed barred more than 30 banks from buying back their stock, potentially impacting the performance of bank stocks.
While the current market conditions may seem challenging, they could potentially present a golden opportunity for contrarian investors. Conducting thorough research and making informed decisions when investing in bank stocks is essential. Remember, the door of opportunity is there; you only need to push.
Bank Stocks: Buy When There’s Blood in the Streets?
“The time to buy is when there’s blood in the streets.”** – Baron Rothschild
This famous quote from the 18th-century British nobleman and member of the Rothschild banking family encapsulates the essence of contrarian investing. It suggests that the best time to invest is when pessimism about the market is at its highest.
Looking at a long-term chart from 1999 to the present, we see that despite significant market crashes, such as the dot-com bubble burst in 2000 and the COVID-19 crash in 2020, the overall trend is upward. During these periods of market turmoil, the chorus of doom and gloom from the masses is often deafening. Yet, history has shown us that every stock market crash since the inception of the market has laid the foundation for the next massive bull market.
Investors often fall into a cycle of fear and greed. When markets are booming, everyone is happy, and stocks are usually overpriced. However, when markets crash and panic sets in, investors often sell their stocks at a fraction of their value. This cycle repeats itself over and over again, with many investors vowing never to make the same mistake again, only to fall into the same trap when the next market downturn occurs.
The Opportunity in Bank Stocks
This cycle of fear and greed presents a unique opportunity for contrarian investors. The best time to buy bank stocks, or any other good stock, is when the markets are pulling back firmly. The stronger the deviation from the norm, the better the opportunity.
While it’s important to seize opportunities when they arise, it’s equally important to exercise prudence. Investing in bank stocks, like any investment, carries risk. It’s crucial to conduct thorough research, understand the risks involved, and make informed decisions.
While the naysayers will always find something to scream about, it’s important not to let fear dictate your investment decisions. The best time to buy maybe when there’s blood in the streets, but exercising prudence and making informed decisions is equally important. Remember, the door of opportunity is there; you only need to push.
Banking Index Consolidating: It could be time to get into bank stocks.
A look at the banking index shows that it is consolidating, and as long as it does not trade below 65.00 every month, the outlook will remain bullish. There is overhead resistance at 74.50, and it will take a weekly close above this level to suggest a move to the 80 range is underway. If it is going to trade any higher, a monthly close above 81 will be required. If it achieves this, it will be on its way to putting in a series of new highs.
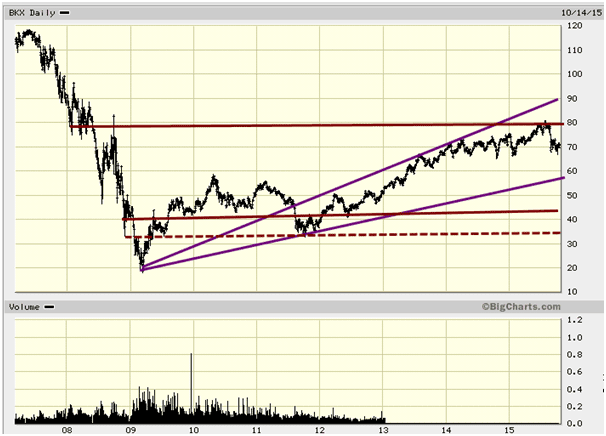
This 10-year chart illustrates how much the banking index has recovered from the mortgage crisis. Many might look at the chart and state, “Well, it’s still trading significantly below its all-time highs”, so the outlook must be downright harmful. These individuals conveniently forget to consider just how long it took for the index or market to reach that point in the first place. If you look at things from this perspective, every correction would have to be viewed negatively. For a brief period, the pattern would not look great.
For example, you could make the same argument by looking at a market over a concise term, such as 60 minutes or even a one-minute chart. On a 60-minute chart, a market that looks bullish on one one-year chart could look like it was crashing because, on the 60-minute chart, the pattern is entirely different. You have mini-corrections and rallies occurring all the time, and even more so if you move to a one-minute chart, you would see crashes and strong rallies taking place on a much faster scale.

Thus, the market could appear to be rallying or crashing at any given point. The time scale could distort your view. One person could walk away feeling that the market was bullish, while the other would feel certain that the markets were in a bearish phase. In this instance, the time scale could push one towards forming the wrong conclusion. Instead of looking at how far a market has to rally to catch up to its old highs, why not look at how far it has already traded?
The importance should always be on the now; the now is all you control, the second before is gone and unchangeable, the second to come is beyond your reach.
Best Banks for Long-Term Investment: Updated List Oct 2023
Investing in bank stocks can be profitable, especially for long-term investors. Here are a few bank stocks that have shown promising performance historically and are poised for growth in the future.
1. JPMorgan Chase & Co. (JPM)JP
Morgan Chase is one of the largest and most well-established banks in the world. Over the past two decades, it has consistently delivered strong financial performance, even during periods of economic downturn. For instance, in the two years following the COVID-19 pandemic, the Federal Reserve bought $4.5 trillion of U.S. Treasuries and mortgage-backed securities, which led to extraordinary liquidity and increased bank deposits from $13 trillion to $18 trillion. This undoubtedly drove increased prices across many investment classes, including bank stocks like JPMorgan Chase.
Bank of America Corp. (BAC)
Bank of America is another banking giant with a strong track record of performance. It has a broad and diversified business model, which helps it generate consistent revenue and profits. Over the next decade, market returns are expected to fall short of long-term historical averages. However, Bank of America’s diverse portfolio of services and strong customer base position it well to weather potential headwinds and deliver solid returns.
Wells Fargo & Company (WFC)
Wells Fargo has had its share of challenges in recent years, but it remains one of the largest banks in the U.S. and has a strong presence in the mortgage market. Despite the company-level and macroeconomic headwinds, Wells Fargo’s attractive starting valuations and potential for earnings growth make it a bank stock worth considering for long-term investment.
4. Citigroup Inc. (C)
Citigroup is a global bank with a presence in more than 160 countries. It offers a range of financial products and services, including consumer banking and credit, corporate and investment banking, securities brokerage, and wealth management. Despite trading below its pre-2008 highs, Citigroup’s global footprint and diverse business operations make it a potentially profitable long-term investment.
5. Goldman Sachs Group Inc. (GS)
Goldman Sachs is a leading global investment banking, securities, and investment management firm. It provides a wide range of financial services to a substantial and diversified client base, including corporations, financial institutions, governments, and individuals. Goldman Sachs’ strong brand and reputation, coupled with its ability to generate high returns on equity, make it a compelling choice for long-term investors.

Published in 2015, meticulously updated over the years, culminating in the latest revision in October 2023 for cutting-edge relevance.
Other articles of interest:
Negative Thinking: How It Influences The Masses (Oct 29)
Current Stock Market Trends: Embrace Strong Deviations (Oct 2)
Market Insights: October Stock Market Crash Update (Oct 1)
