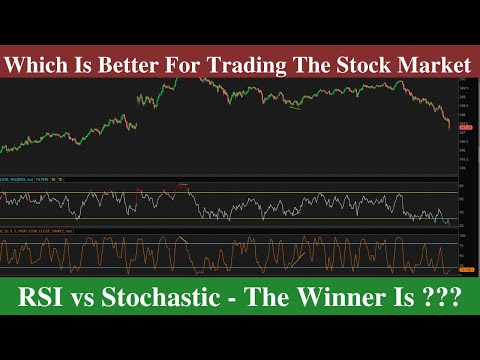
Stochastic Oscillator vs RSI: The Hidden Psychological Battlefield of Market Mastery
March 19, 2025
While ordinary traders obsessively debate which technical indicator reigns supreme between the Stochastic Oscillator and RSI, they fundamentally misunderstand that the true battleground lies not in the mathematical formulas themselves but in the psychological terrain these tools were designed to illuminate. This intellectual myopia explains why most practitioners achieve mediocre results despite religiously applying these powerful indicators—they focus on the mechanical signals while remaining blind to the profound psychological insights these instruments were specifically engineered to reveal. The Stochastic Oscillator and RSI represent not merely technical calculations but sophisticated psychological barometers that quantify the eternal struggle between fear and greed, momentum and exhaustion, that ultimately drives all market movements. These tools emerged not from abstract mathematical theory but from practical observation of how human psychology manifests in collective market behaviour, creating recurring patterns that transcend time, geography, and asset class. This essay will explore not merely how these indicators mechanically function but how understanding their psychological foundations transforms them from simple trading signals into profound revelatory instruments—positioning you to perceive the invisible emotional currents that drive markets while others remain trapped in superficial technical analysis. The devastating reality is that most traders will continue treating these psychological X-ray machines as simplistic overbought/oversold indicators, while the sophisticated minority who grasp their deeper significance gain extraordinary insight into the market’s emotional state precisely when that insight creates maximum strategic advantage.
The Psychological Foundations: What These Indicators Actually Measure
The fundamental distinction between the Stochastic Oscillator and RSI emerges not from their mathematical formulas but from the specific psychological dimensions of market behaviour each was designed to quantify. Understanding these psychological foundations transforms these tools from abstract technical indicators into profound windows into collective market psychology—revealing invisible emotional forces that ultimately determine price movement far more powerfully than fundamental factors during crucial market turning points.
Consider first the profound psychological insight embedded within the Stochastic Oscillator’s design. When George Lane developed this indicator in the 1950s, he based it on a sophisticated observation about market psychology: prices tend to close near their recent highs during uptrends and near their recent lows during downtrends. This pattern reflects not random price movement but specific psychological behaviour—momentum continuation through what behavioural economists call “recency bias,” our tendency to overweight recent experiences in predicting future outcomes. The genius of Lane’s design lies in how it quantifies this psychological pattern through comparison of closing prices to recent trading ranges—creating a mathematical representation of collective emotional commitment to existing trends.
The %K and %D lines within the Stochastic reveal not merely technical levels but psychological transition points where collective market behaviour demonstrates characteristic exhaustion patterns. When these lines reach extreme readings above 80, they identify not simply “overbought” conditions but psychological states where buying enthusiasm has reached unsustainable intensity—creating the precise conditions where natural exhaustion typically emerges as new buyers become scarce. Conversely, readings below 20 signal not merely “oversold” conditions but psychological capitulation—the emotional state where selling pressure has typically exhausted itself as remaining holders demonstrate strong conviction through unwillingness to sell despite continued pressure.
The RSI operates through different psychological mechanisms that complement rather than duplicate the Stochastic’s insights. J. Welles Wilder designed this indicator specifically to measure the velocity and magnitude of directional price movements—quantifying what market psychologists call “emotional momentum” in upward or downward directions. This approach creates extraordinary sensitivity to acceleration and deceleration in collective market psychology, revealing when emotional intensity begins waning before this weakening becomes visible in price action itself. The mathematical comparison of average gains to average losses creates a psychological ratio that quantifies the balance of optimism versus pessimism driving recent price action.
What makes RSI particularly powerful is its ability to identify what psychologists call “conviction divergences”—situations where emotional commitment weakens despite continued price movement in existing directions. When prices make new highs while RSI fails to exceed previous peaks, this pattern reveals not technical failure but psychological exhaustion—the waning of emotional energy necessary to sustain trend continuation despite surface-level price strength. This divergence identifies the precise psychological inflection points where collective momentum transitions from acceleration to deceleration, frequently preceding significant reversals.
The profound implication is that mastering these indicators requires understanding them not as mechanical trading signals but as sophisticated psychological measurement tools—each designed to quantify specific dimensions of collective market behaviour that remain invisible to purely price-based analysis. By comprehending the psychological insights these indicators reveal, the sophisticated practitioner gains extraordinary perspective on collective market emotions precisely when that perspective creates maximum strategic advantage during critical market transitions.
The Comparative Advantage: When Each Indicator Reveals Superior Insight
The Stochastic Oscillator and RSI each demonstrate distinct psychological advantages in specific market contexts—with their relative effectiveness determined not by inherent superiority but by alignment between their design characteristics and particular market psychological states. Understanding these contextual strengths creates the foundation for strategic implementation that employs each indicator precisely when its psychological insights prove most revelatory.
Consider first the Stochastic Oscillator’s superior performance in range-bound markets—environments characterized by what psychologists call “mean-reverting behaviour” where prices oscillate between established support and resistance levels. This pattern emerges from specific psychological dynamics: collective uncertainty creates balanced opposition between bullish and bearish perspectives, with neither gaining sufficient strength to establish sustained directional momentum. The Stochastic’s design—comparing closing prices to recent trading ranges—creates extraordinary sensitivity to the psychological turning points where mean-reverting behaviour typically manifests.
This contextual advantage appears with particular clarity in commodity markets like crude oil during periods of supply-demand equilibrium. When fundamental factors remain relatively stable, price action frequently exhibits psychological oscillation between established boundaries. During such periods, the Stochastic consistently identifies high-probability reversal points where collective psychology shifts from buying to selling enthusiasm (above 80) or selling to buying pressure (below 20). These signals reflect not random fluctuations but psychological exhaustion points where emotional extremes naturally resolve through corrective movement.
Conversely, the RSI demonstrates superior psychological insight during trending markets—environments characterized by sustained directional movement driven by collective emotional commitment to particular narratives. This advantage emerges from the indicator’s specific design sensitivity to momentum persistence and emotional conviction. By measuring average gains versus average losses over specified periods, the RSI quantifies the strength and sustainability of directional commitment—revealing when psychological momentum remains sufficiently powerful to continue existing trends despite short-term countermovement.
This contextual strength appears with remarkable clarity in technology stocks during innovation-driven growth phases. When collective psychology embraces particular technological narratives—as occurred during the cloud computing expansion of 2016-2019—price action frequently demonstrates powerful directional trends with brief countertrend movements. During such periods, the RSI consistently distinguishes between minor corrections that resolve through continued trend movement versus genuine reversals where emotional momentum fundamentally shifts. The 40-60 zone frequently serves not as arbitrary technical range but as psychological boundary separating temporary retracements from significant trend changes.
What unifies these contextual advantages is their foundation in psychological pattern recognition rather than mechanical signal generation. The superior practitioner employs these indicators not through rigid application regardless of context, but through deliberate selection based on alignment between market psychological conditions and indicator design characteristics. When markets demonstrate range-bound behaviour driven by collective uncertainty, the Stochastic’s sensitivity to mean-reverting psychology creates superior insight. When markets display trending behaviour reflecting strong directional conviction, the RSI’s momentum measurement provides more revelatory perspective on collective psychological commitment.
The Synergistic Integration: How Psychological Convergence Creates Superior Signals
The most powerful implementation of the Stochastic Oscillator and RSI emerges not through treating them as competing alternatives but through synergistic integration that combines their complementary psychological insights. This approach transforms potential contradiction into profound confirmation—creating high-conviction signals when these distinct psychological measurements independently identify identical market conditions through different analytical mechanisms.
Consider the extraordinary psychological validation that emerges when both indicators simultaneously signal potential reversal from different analytical perspectives. When the Stochastic identifies price extremes relative to recent trading ranges (readings above 80 or below 20) while the RSI simultaneously demonstrates momentum divergence (weakening indicator readings despite continued price movement), this convergence represents not merely technical agreement but profound psychological confirmation from complementary measurement systems. The Stochastic confirms price has reached statistical extremes relative to recent activity while the RSI independently validates that emotional momentum no longer supports continued movement in the current direction.
This synergistic integration manifests with particular power during market turning points following extended trends. During the January 2018 S&P 500 peak preceding a 10% correction, both indicators provided advance warning through distinct but complementary psychological signals: the Stochastic registered multiple readings above 90, identifying extreme price position relative to recent trading, while the RSI simultaneously displayed bearish divergence where indicator peaks failed to match corresponding price highs. This convergence reflected profound psychological exhaustion identified through different measurement mechanisms—creating extraordinary conviction that collective market psychology had reached unsustainable extremes despite continued surface-level strength.
Beyond simple directional agreement, sophisticated integration examines the sequence and relationship between how these indicators respond to evolving market psychology. When the faster-moving Stochastic shifts direction before the RSI, this pattern frequently identifies what market psychologists call “early rotation”—the initial psychological transition where shorter-term traders begin repositioning before longer-term participants. Conversely, when the RSI changes direction before the Stochastic, this sequence often signals what market strategists term “fundamental revaluation”—deeper psychological reassessment that emerges first in momentum measures before manifesting in immediate price action.
This relationship dynamic created extraordinary insight during the March 2020 market bottom following the COVID-19 decline. As markets approached their eventual lows, the RSI demonstrated early bullish divergence (making higher lows while prices continued lower) several days before the Stochastic generated traditional oversold signals. This sequence identified a profound psychological pattern: underlying buying conviction was strengthening (captured by the RSI) before this emerging support became visible in immediate price action relative to recent trading ranges (measured by the Stochastic). Traders recognizing this psychological progression positioned for reversal significantly earlier than those relying on either indicator independently.
The strategic implementation involves creating specific confirmation frameworks that require agreement between these distinct psychological measurements before committing significant capital. Rather than treating minor disagreements as confusing contradiction, recognize them as valuable nuance revealing different dimensions of evolving market psychology. When both indicators align from their unique perspectives, this convergence creates the highest probability setups—situations where multiple psychological measurements independently confirm identical market conditions through different analytical mechanisms, providing extraordinary conviction during critical decision points.
The Divergence Mastery: Psychological Insights Beyond Basic Readings
While basic overbought/oversold readings provide valuable perspectives on collective market psychology, the most profound insights from both the Stochastic Oscillator and RSI emerge through divergence analysis—situations where indicator behaviour contradicts price action to reveal invisible psychological shifts occurring beneath visible market movements. Mastering these divergence patterns transforms these tools from simple momentum measurements into sophisticated early warning systems that identify crucial psychological transitions before they become obvious in price action itself.
Consider first how bearish divergence—where prices make higher highs while indicators form lower highs—reveals critical psychological exhaustion long before price reversal becomes evident. This pattern identifies what behavioural economists call “waning conviction momentum”—situations where continued price appreciation occurs with decreasing emotional energy and participation. The divergence doesn’t merely suggest technical weakness but illuminates profound psychological vulnerability where price movements continue through inertia despite deteriorating underlying support—creating precisely the conditions where sharp reversals frequently emerge once this superficial momentum exhausts itself.
The 2021 ARK Innovation ETF (ARKK) peak demonstrates this psychological pattern with extraordinary clarity. While prices pushed to final highs in February 2021, both the Stochastic and RSI formed lower peaks compared to previous price highs—identifying weakening momentum despite continued appreciation. This divergence revealed not simply technical weakness but profound psychological vulnerability: buying enthusiasm was waning even as prices reached final extremes, creating the precise conditions where sustainable support typically collapses once marginal buying exhausts itself. Traders, recognizing this psychological deterioration, were positioned defensively weeks before the eventual 75% decline that followed.
Equally powerful, bullish divergence—where prices form lower lows while indicators create higher lows—identifies what market psychologists call “exhausted selling pressure” before visible price reversal occurs. This pattern reveals weakening emotional commitment to continued decline despite ongoing price deterioration—frequently signaling capitulation completion where selling pressure has fundamentally exhausted itself even as final price weakness persists. The psychological insight comes not from arbitrary technical patterns but from quantifiable evidence that emotional energy driving the existing trend has fundamentally diminished despite continued price movement.
The March 2020 market bottom following the COVID-19 crash provides textbook illustration of this psychological dynamic. As major indices made their final lows, both indicators formed higher lows compared to earlier decline phases—identifying crucial psychological shifting despite continued price weakness. This divergence revealed not technical curiosity but profound psychological transition: selling pressure was fundamentally exhausting itself even as final price weakness created maximum pessimism. Traders recognizing this psychological shift positioned aggressively for reversal, capturing extraordinary returns during the powerful recovery that followed.
What makes divergence analysis particularly powerful is its foundation in psychological reality rather than mystical technical patterns—these formations identify specific emotional transitions where collective market behaviour demonstrates measurable exhaustion before this changing psychology becomes visible in price action itself. By recognizing these patterns as early warning signals of shifting market psychology rather than arbitrary technical formations, sophisticated practitioners position themselves to anticipate rather than react to major market transitions precisely when this anticipatory capacity creates maximum strategic advantage during crucial inflection points.
The Adaptive Framework: Selecting the Right Psychological Tool for Market Conditions
The ultimate mastery of the Stochastic Oscillator and RSI emerges through developing adaptive frameworks that deliberately select the appropriate psychological measurement tool based on specific market conditions rather than rigidly applying either indicator universally. This contextual implementation transforms potential confusion into strategic advantage—employing each tool precisely when its psychological design characteristics align most effectively with current market behaviour patterns.
Consider how market volatility fundamentally alters which indicator provides superior psychological insight. During low-volatility periods characterized by gradual, orderly price movements, the RSI frequently demonstrates superior measurement capability—its momentum calculation effectively captures the subtle psychological shifts that precede meaningful direction changes in quiet markets. Conversely, during high-volatility environments featuring rapid, emotional price movements, the Stochastic’s sensitivity to immediate price position relative to recent trading ranges often provides more valuable perspective on psychological extremes where counter-trend reversals become probable.
This contextual selection manifests through specific implementation protocols that adjust indicator emphasis based on quantifiable market conditions. When average true range (ATR) readings demonstrate significant expansion indicating heightened volatility, sophisticated practitioners increase reliance on Stochastic signals—particularly focusing on extreme readings that identify potential exhaustion points within volatile price action. When ATR readings contract, indicating reduced volatility, emphasis shifts toward RSI analysis with particular attention to subtle momentum shifts that frequently precede larger movements in quiet market environments.
Similarly, market structure—trending versus range-bound—fundamentally determines which indicator generates superior psychological insight. During established directional trends confirmed by price remaining consistently above or below key moving averages, the RSI’s momentum measurement provides a particularly valuable perspective on trend strength and potential exhaustion. During range-bound conditions where prices oscillate between defined boundaries, the Stochastic’s design creates superior sensitivity to reversal points where prices approach previous extremes within established ranges.
This adaptive approach manifests through specific implementation frameworks that integrate both indicators while adjusting their decision weight based on quantifiable market conditions. Create scoring systems that increase RSI significance during trending periods while elevating Stochastic importance during range-bound environments—weighting each tool’s input according to alignment between market structure and indicator design characteristics. This methodology transforms potential confusion from conflicting signals into sophisticated contextual analysis that employs each indicator precisely when its psychological insights prove most revelatory.
Beyond simple indicator selection, timeframe integration creates extraordinary strategic advantage through what market psychologists call “temporal confirmation”—where identical signals appear across multiple measurement periods to create exceptional conviction. When both indicators demonstrate identical directional signals (particularly divergence patterns) across multiple timeframes simultaneously, this convergence creates not merely technical agreement but profound psychological confirmation that collective market behaviour demonstrates consistent patterns across different participant groups from short-term traders to longer-term investors.
Begin implementing this adaptive approach by establishing specific market classification frameworks that quantifiably identify current conditions—trending versus ranging, high versus low volatility—using objective measurements rather than subjective assessment. Create decision protocols that adjust indicator emphasis based on these classifications, deliberately selecting the psychological measurement tool most aligned with current market behaviour patterns. This contextual implementation transforms potential indicator conflict into sophisticated strategic advantage—employing each tool precisely when its psychological design characteristics create maximum insight into current market conditions.
Conclusion: From Technical Signals to Psychological Mastery
The debate between Stochastic Oscillator and RSI fundamentally misunderstands that these tools represent not competing alternatives but complementary psychological measurement systems—each designed to quantify different dimensions of collective market behaviour that ultimately determines price movement. The sophisticated practitioner recognizes that the choice is not which indicator to use exclusively, but how to integrate their complementary insights into comprehensive understanding of market psychology that neither tool could provide independently.
What distinguishes the master from the mediocre is not technical calculation but psychological interpretation—recognizing these indicators as windows into collective emotional states rather than mechanical trading signals. While average practitioners robotically react to crossovers and arbitrary levels, sophisticated operators use these tools to develop profound understanding of the psychological forces driving current market behaviour—positioning with extraordinary conviction when multiple measurement systems independently confirm identical conditions through different analytical mechanisms.
The Stochastic Oscillator excels in quantifying immediate price position relative to recent trading ranges—providing exceptional insight into potential reversal points within range-bound markets where mean-reverting behaviour dominates. The RSI demonstrates particular strength in measuring momentum and directional conviction—offering superior perspective on trend sustainability and potential exhaustion within directional environments driven by persistent psychological commitment. Rather than declaring one superior, the master employs each precisely when its design characteristics align most effectively with current market conditions.
Begin implementing this integrated approach immediately through specific practices that develop psychological depth rather than mechanical signal generation. Maintain dedicated journals documenting how these indicators perform across different market conditions—building personalized understanding of when each tool provides superior insight based on your specific trading approaches and timeframes. Develop convergence frameworks that generate maximum conviction when both indicators independently confirm identical conditions through their distinct measurement methodologies. Most importantly, cultivate the intellectual flexibility to adjust implementation based on market conditions rather than rigidly applying either tool universally regardless of context.
Through these deliberate practices, you transform from mechanical indicator follower to sophisticated psychological observer—capable of perceiving the invisible emotional currents driving market movements while others remain trapped in superficial technical analysis. This psychological dimension represents the ultimate sustainable edge in markets increasingly dominated by algorithmic efficiency and informational parity—creating extraordinary advantage through superior understanding of the human elements that continue driving collective behaviour despite technological transformation.
The profound reality is that markets represent not merely economic exchange mechanisms but manifestations of collective human psychology operating at institutional scale. By approaching the Stochastic Oscillator and RSI as sophisticated windows into this psychological reality rather than mechanical trading systems, you position yourself among the select minority who recognize that sustainable market mastery emerges not from technical calculation but from profound understanding of the emotional forces that ultimately determine price movement across all markets, timeframes, and asset classes.