


Volatility Distracts. Positioning Matters More.
Overview
- SOX mania, tariff volatility, sentiment divergence, and the growing power strain behind the AI race.
- The Mother of All Buy signal generated on May 7, 2025 remains valid.
- At the same time, the Resource Remobilisation trend continues to unfold beneath the daily market theatre.
- The key question remains unchanged: are these markets building toward broad euphoria, or are we still in the pressure phase where volatility creates opportunity rather than signals collapse?
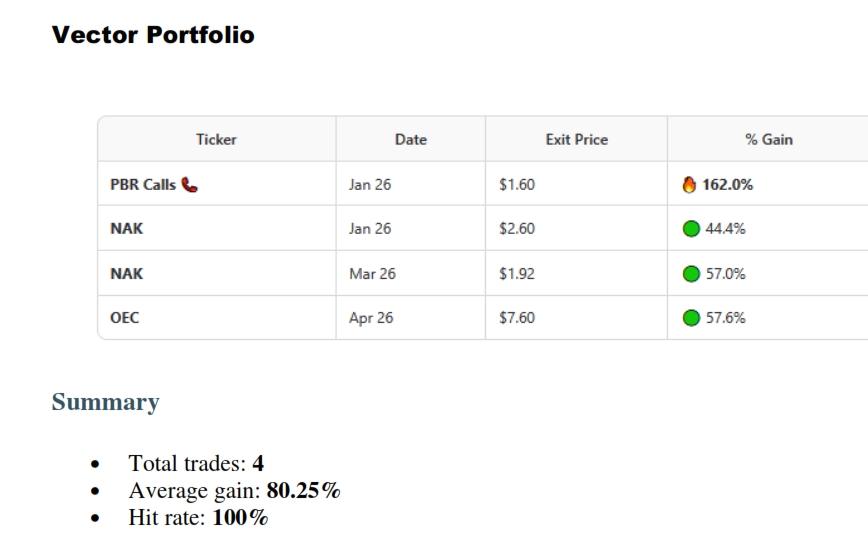
- The Vector Portfolio also continues to maintain its 100% closed-trade win rate, reinforcing the view that positioning and trend still matter more than daily noise. The latest winner, OEC, was closed for a gain of 57.5% bringing the average gain per closed position to roughly 80%. Full details are posted below under Positioning and Portfolio Updates.
We expand on all of these points below.
The Noise
There are many things unfolding at once. One of the more obvious developments is that Donald Trump’s mouth, and those tied to his administration, have effectively become the new CBOE Volatility Index. Since the last newsletter, roughly two weeks ago, conflicting statements have been issued regarding Iran. If the tone sounded constructive, markets pushed higher. If the tone shifted negatively, markets pulled back. Then came the sudden attack on the European Union, with Trump floating the possibility of 25% tariffs after stating, “The European Union is not complying with our fully agreed to Trade Deal.”
We’re not going to debate the morality, or lack thereof, behind these statements. You don’t need us for that.
What matters is that this kind of rhetoric injects volatility into the system, and one can reasonably argue that those with even a modest amount of foresight can make enormous sums from these swings over time. So how does the smaller player benefit? Focus on the trend and the greed factor. The greed factor is measured through sentiment data. If bullish sentiment is not at extreme levels, then regardless of personal views, pullbacks still have to be treated constructively. History supports that approach.
What we told our subscribers.
Until we receive a clear signal that the crowd has turned euphoric, sharp corrections should be embraced and viewed through the lens of opportunity rather than disaster. Interim Market update April 24, 2026
SOX Mania and Sentiment Divergence
Then came the sudden move in the SOX index, a surge only seen once before in history.
It has surged, or bolted if you prefer, 47.2% in just 19 trading days. Has it rallied 40% before? Yes, twice. But only once before did it match the current 47% move, roughly from mid-March to early April 2003. If we lower the threshold to just under 45%, it also occurred from February 10 to March 14, 2000, when it gained roughly 43.9% into the dot-com peak. So, we have one example near a bottom and one near a peak. That is far from a clear signal or coherent pattern, and dangerous ground on which to build a strategy, if used in isolation. Given the current FOMO action, we suspect bullish sentiment may need to surge to at least 60%, if not higher, as the mania in this sector is substantial. However, it would be prudent to become more defensive if bullish sentiment approaches the 55 level. Market Update April 27, 2027
Then sentiment did something unusual. Two weeks ago, bullish sentiment was close to 51, and under normal conditions one would expect it to push higher as the market moved to new highs. Instead, something odd transpired. Sentiment dropped back toward its historical average. That’s both interesting and highly unusual. Markets are pushing to new highs, yet the crowd is not broadly euphoric. The euphoria is concentrated mainly in the AI space and in anything even loosely tied to AI.
And just to add another layer to the confusion, we now have this from the Buffett Indicator.
The Buffett Indicator, which measures the total value of U.S. stocks as a percentage of GDP, according to Guru Focus, now stands at 227%. That is roughly one-sixth higher than the 200% threshold Buffett himself identified as the danger zone.
Our response to the Buffett Indicator development:
Very scary in isolation, that statement is. But in reality, without supporting patterns it offers little in the way of tradable data. And if you try to short the market based on that alone, you could be blown out of the water. Market update April 27, 2026
Right now, you have a flood of events, each one telling a different story. If you want, you can build a perfect narrative for a crash, or one for the bull market pushing much higher. We lean bullish because the pattern still supports it. Surprisingly, the euphoria factor is still missing.
The Signal Still Holds
At the same time, the MOAB (Mother of All Buy Signal) triggered on May 7, 2025 remains valid and has not been invalidated.
Hence the best strategy in this environment is not prediction, but positioning. Focus on the data in front of you and the trend itself. We continue doing what we’ve been doing all along, taking profits in sectors running too hot and redeploying capital into sectors that are still strong but have already let out steam, are disliked, or simply ignored.
Our view remains simple:
In this type of setup, where uncertainty dominates, the path of least resistance tends to be up, but rarely in a straight line: sharp, wild yo-yo action should be expected. Interim market update April 21, 2026
The only thing left to decide is whether the market tests its old highs, and by market, we mean the indices, because beneath that surface, things are already splitting apart. We’re either heading toward a retest, or we get more of this see-saw action, one step forward, one and a half steps back, just enough to keep both the bulls and the bears uncertain and uncomfortable. Market Update April 6, 2026
Closing Thoughts
A recent example. Markets pushing to all-time highs, yet bullish sentiment never even reached 55 (The highest bullish sentiment reading so far came in at 50, and that occurred on April 27th). Then, almost immediately (this week), sentiment drops sharply (reading of 38). In this kind of environment, the worst move is to assume things will behave in a way that makes sense. You’re going to see actions, both in and out of markets, that don’t line up cleanly/defy common sense. Best to stay grounded and adjust as it unfolds. Market Update May 1st, 2026
Right now, the data can support both the bullish and bearish case. We prefer not to lean and let the data do the talking.
Markets are driven by perception, and perception comes from observation. Those observations can be accurate, distorted, emotional, or completely biased. In the end, what matters is not whether the observation is pure, but the behavioural response it creates. Perception shapes the crowd’s version of reality. So, the focus is not on what should happen, could happen, or what we think ought to happen. The focus is on what is actually happening.
As strange as it sounds, and at times it feels almost unreal, the euphoria factor is still missing. Based on Vector Mass Psychology, there is very little coherence in the current action. Until that changes, the safer approach is still to view pullbacks through a bullish lens.
Power Sector: The AI Race Is Starting to Look Like a Power Race
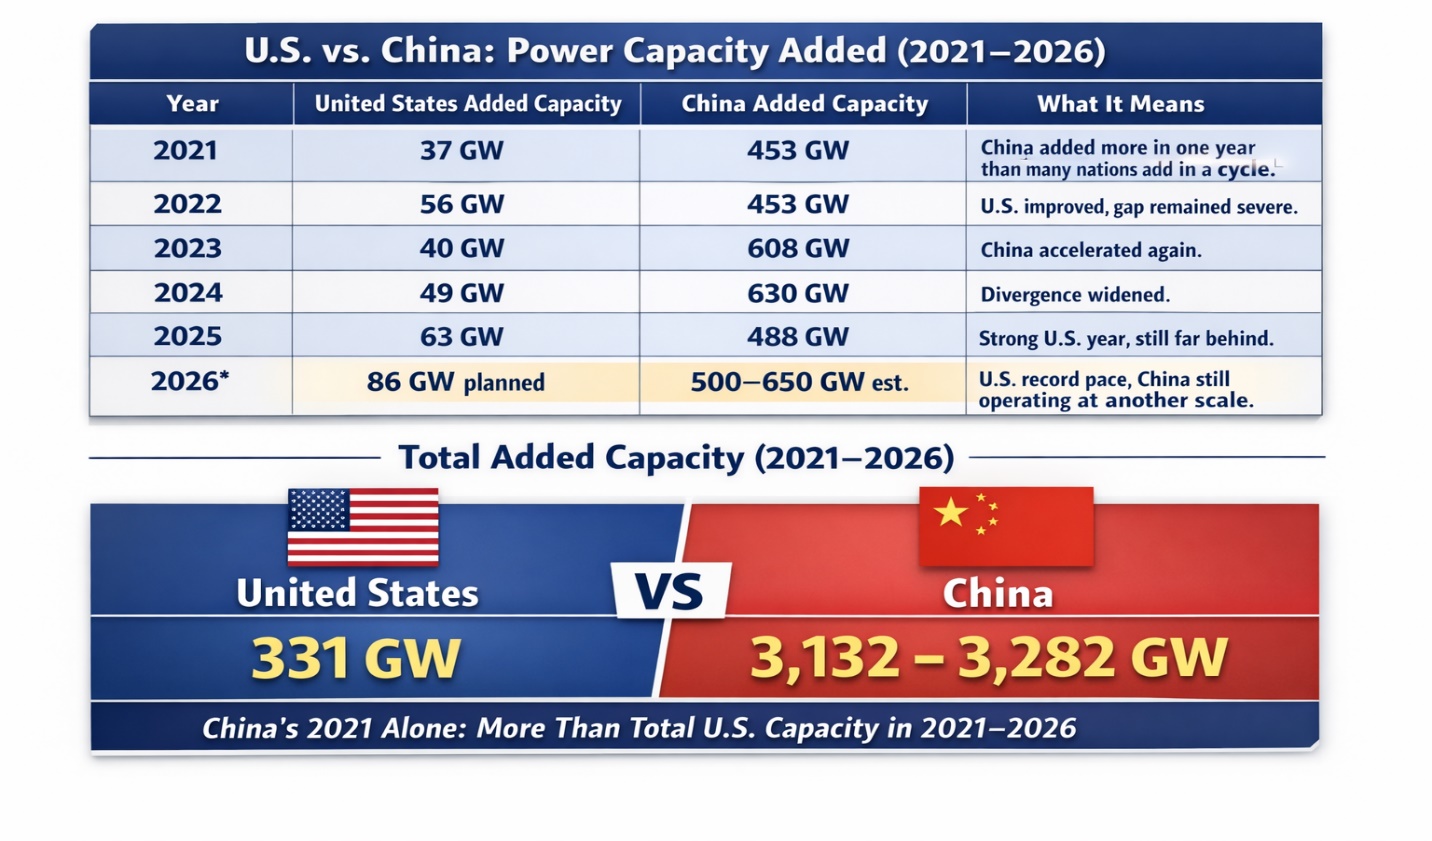
We could write pages on this, but the image below says enough. In 2021 alone, China built more power capacity than the United States has built from 2021 to today, including what the US is expected to add in 2026. Let that sink in.
The AI race is far from over. The US still leads in chips, design, software, and the broader ecosystem. China appears to lead in power generation, engineering talent, and increasingly robotics. Their LLM models are good too, still behind the best US models, but close enough to raise a real question. Does spending vastly more money for a marginal edge make sense when it is not leading to equally massive breakthroughs? We will let the market answer that itself. It does the job far more efficiently.
Something eventually has to give. Either the US finds scalable power fast or red tape gets gutted so nuclear and other infrastructure can be deployed rapidly. Right now, the market is starting to say the real bottleneck is not chips, but raw power. Faster chips, better fibre optics, improved memory, tighter packing, none of it matters without electricity.
Take Bel Fuse Inc. (BELFB), Quanta Services Inc. (PWR), nVent Electric plc (NVT), even Cummins Inc. (CMI). These names exploded higher and outperformed many fashionable AI stocks over the past 12 months. An initial breakout can sometimes be a head fake, but the broad participation suggests otherwise. This is likely the start of a longer-term trend, as the moves across this sector confirm that power is indeed a real issue in the AI race. Having said that, don’t chase these names after a strong run. Better to let the sector blow off some steam before stepping in.
Everything that rises eventually meets gravity. Especially in markets. Or as Confucius might have observed, when a man mistakes height for strength, the fall begins before the drop is seen.
Oil and Resource Remobilisation
The one-year and weekly charts point to volatility, but the long-term quarterly chart still suggests more upside. We’ll continue adjusting positions as conditions change, trimming some and leaning harder into others.
Long-term trends never move in straight lines. If they did, everyone would be rich. The pattern is usually the same, sharp advances, hard pullbacks, then continuation. The stronger the trend, the more violent the shakeouts tend to be.
Many experts will scream about $300 oil. Possible? Yes. Likely? Probably not. Very few major players actually want to destroy the system that feeds them. Fear sells well though, so every cycle produces a fresh batch of doomsayers selling collapse as certainty.
The Resource Remobilisation trend is still alive, but it will punish anyone expecting a smooth ride. The approach remains simple. Use sharp pullbacks to build positions and periods of extreme bullishness to take profits.
Polarisation is now so extreme that almost every topic turns into a powder keg. That’s why we prefer observation over reaction. Administrations change, slogans change, faces rotate, but the machinery underneath rarely shifts much. Division remains one of the easiest ways to control attention while larger agendas move quietly in the background.
Meanwhile markets keep reacting to headlines, threats, reversals, and carefully timed statements. Down one day, up the next. The crowd focuses on the theatre while the deeper structural trends keep moving almost untouched.
Positioning and Portfolio Updates
Positioning matters more than prediction, especially in fragmented markets like this. That remains the core philosophy behind both the Vector Portfolio and the Bread and Butter Portfolio. Despite the volatility and constant narrative shifts, the Vector Portfolio continues to maintain a 100% closed-trade win rate, with the average gain per closed position now standing at roughly 80.25%. The Bread and Butter Portfolio, designed for lower-risk positioning, continues to show a similar pattern, with every closed position exited at a profit so far.
The Vector Portfolio continues to maintain a 100%-win rate, with another winner recently added to the list. The average gain per closed position now stands at roughly 80.25%.
Current open positions (3 open) also all in the black. As always, the objective is not quantity, but selectivity. The ideal range remains roughly five positions, with a hard cap near seven, and so far, we have managed to stay within those parameters. Markets rarely move in straight lines, so flexibility still matters more than rigidity.
The Bread and Butter Portfolio, designed for lower-risk positioning, continues to show a similar pattern. To date, every closed position has been exited at a profit.
Special Offer
Due to continued interest, the Special Trial Offer will remain open for now. Readers who have not used the trial within the past four months may use it again.
Subscribers joining during this period will also retain ongoing access to the Vector Portfolio.
Readers may choose either monthly or annual billing under the trial offer structure. As always, subscriptions may be cancelled at any time directly through the account dashboard.
Trial Offer Converting to Monthly Subscription ($49.99)
https://tacticalinvestor.com/tactical-trial/
Trial Offer Converting to Annual Subscription with Additional Savings ($474.99)
https://tacticalinvestor.com/discount-21-offer/
P.S. In the next issue we may touch on something rather interesting involving perception and markets. For now, we’ll leave it there.
