
Japanese Yen to Dollars Dynamics: Resilience and Rally Ahead
Dec 11, 2025
Over the past decade—stretching from the bold calls of early 2013 to the crosscurrents shaping 2025—the story of the Japanese Yen to Dollars exchange rate has been one of resilience, recalibration, and recurring volatility. Policy pivots, shifting rate differentials, and changing global risk appetite have all kept the Yen’s path anything but linear, rewarding investors who balance narrative with numbers.
Historical note (Nov 27, 2012): At that time, the Yen was viewed as being in a corrective phase and deeply oversold, setting up for a relief rally lasting one to several weeks before the broader downtrend could resume. The analysis flagged a probable test of the 118.00 area, with 118.00–118.90 marked as a strong support zone likely to spark a more forceful bounce—even if that bounce ultimately failed and the 118 level was later broken. The guidance was clear: absent a confirmed buy signal, the expectation was a probe into that 118.00–118.90 band.
Historical note (Dec 23, 2012): The working threshold for determining whether a bottom was in place was a close that held above 118.08. A decisive close below 118.08, by contrast, would set the stage for a retest of the April 2011 lows.
Subsequent action saw the Yen fail to hold 118.08, slicing through the April 2011 lows. With the daily sell signal still intact at the time, the outlook shifted toward a test of the 110 region. The tactical stance: maintain the view unless a fresh buy signal emerged; if FXY traded down to the 110 area, close existing YCS positions.
As previously outlined, once a tradable bottom presented itself, the plan was to build exposure to FXY—preferably by selling puts and using the premium to finance call purchases, thereby structuring a defined-risk entry.

Shaping the Future: Japanese Yen to Dollars Long-Term Outlook
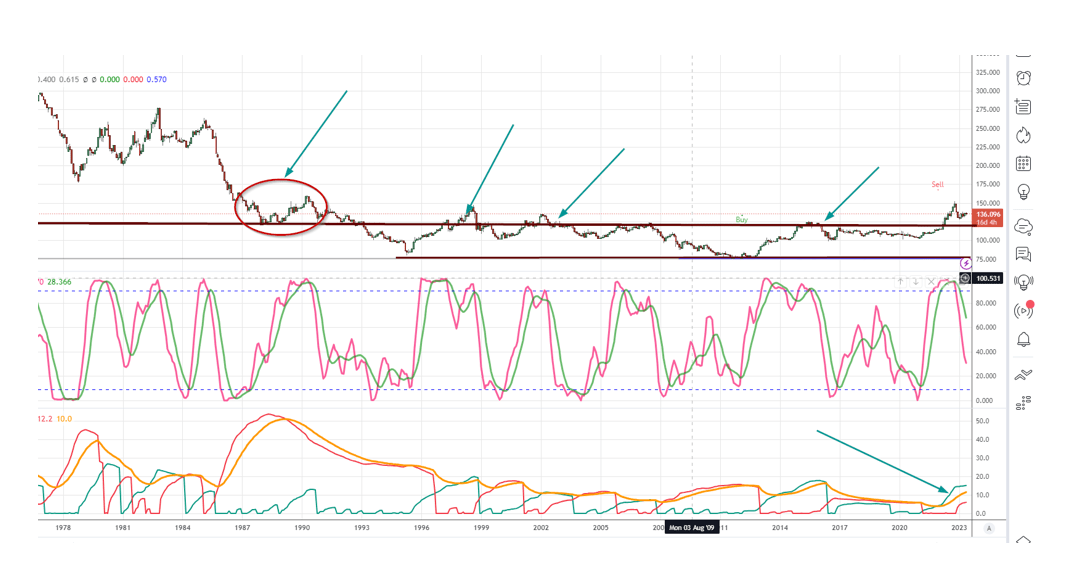
Perspective matters. To understand where the Yen stands today against the Dollar, it helps to zoom out. In the 1970s, the exchange rate hovered above 350 Yen per Dollar, a stark reminder that today’s turbulence exists within a much longer arc of structural change. When viewed through that historical lens, the current landscape is challenging but far from unprecedented.
On longer-term charts, the upper boundary of a multidecade price channel—the brown line in the reference graphic—transitioned from resistance to support, a shift that traces back to the late 1980s (see the red circle). For the Yen’s long-term picture to turn convincingly bullish, that support zone would ultimately need to be reclaimed and held. In this framework, lower index values are constructive for the Yen itself, whereas higher values favor USD holders. A monthly close below 123.00 would open the door for the Yen to challenge the 80 area; until then, expect choppy, high-velocity trading within roughly 124–150.
A Journey of Resilience: Yen–Dollar Trade’s Long-Term Setup and Potential
Patience remains the edge. The base case has been that FXY could revisit its prior lows before a durable long-term bottom emerges—a process that can take years, not weeks. The ideal scenario would see FXY descend toward 60—or even slightly below—while registering a clear positive divergence, signaling downside exhaustion.
Ideal setup: FXY trades at 60 or lower and confirms a positive divergence before entries are considered.
The Yen still offers the ingredients for a substantial multi-year opportunity, much like the Dollar did years ago. When EUR/USD traded above 1.60, calling for eventual parity sounded contrarian; yet it played out. The lesson is simple: in currency markets, cycles can be longer and larger than consensus expects—especially in the Japanese Yen to Dollars pair.

FAQ
Q: What’s the Yen’s current stance versus the Dollar?
A: The longer-term narrative continues to reflect a corrective backdrop punctuated by sharp counter-trend rallies. Oversold conditions can fuel multi-week rebounds before the prevailing trend reasserts itself.
Q: Which technical levels matter for the Japanese Yen to Dollars view?
A: Historically, the 118.00–118.90 band was flagged as a heavy support zone that could spark a stronger rally on first touch. A sustained break afterward would argue for renewed downside momentum.
Q: How would you confirm that a bottom is in place?
A: Holding above 118.08 on a closing basis was the historical trigger for a constructive turn; a decisive close below that mark pointed to a retest of the April 2011 lows.
Q: What’s the longer-term path for the Yen?
A: The roadmap allowed for a slide toward the 110 area before a tradable bottom formed. The focus remains on evidence of a base rather than calling a bottom early; only then would FXY positions be considered.
Q: What historical context helps frame today’s moves?
A: In the 1970s, the Yen traded above 350 per Dollar. On secular charts, a former resistance line became support in the late 1980s. Within that construct, a monthly close below 123.00 would increase the odds of a push toward the 80 zone, while 124–150 implies heightened volatility.
Q: What values are favorable for each side?
A: Lower index values tend to favor the Yen’s longer-term case; higher values benefit USD holders.
Q: What’s the preferred setup for trading FXY?
A: The preferred pathway is to wait for FXY to approach 60 or lower and to see a positive divergence. Structurally, selling puts to finance call purchases has been the favored way to build a position once a base forms.
Q: Is there real long-term potential in the Yen?
A: Yes. Just as the Dollar’s march toward parity with the Euro once seemed improbable, the Yen’s multi-year swings can surprise. For disciplined traders, the Japanese Yen to Dollars cycle can offer outsized opportunities when entries are timed to the larger trend.