
Focus On The Trend & Ignore the noise
Most traders fixate on the S&P 500 or the Dow, and with the advent of the ETF, it makes it easy to go long or short the markets by focussing on ETFs that cover that market or sector. For example, there is more than one S&500 ETF to invest in; in fact, there is a plethora of them to choose from.
However, there is something twice as important, don’t fixate on the investment vehicle until you have identified the trend. In short, once you have identified the trend, the rest is easy; if the S&P is your choice, you can look for the best S&P 500 ETF or invest in several of them. Another option is to select one S&P500 ETF and focus on the strongest holdings. How do you identify the strongest holdings? Well, that is where a bit of technical analysis can prove to be useful. Identify stocks that are trending upwards but, from a technical perspective, are trading in the oversold ranges
Alter the angle of observance.
In other words, do not leap before you look and for heaven’s sake stop following the crowd. The problem with most individuals is that when they look at the markets, they do so with biased eyes. They already have preconceived notions, and they look for data to support these notions. Market Update May 19, 2017
The outlook will be the same for ten years or even 100 years from today. The masses will have learned nothing, for they have learned nothing over the past 100 years and counting. They will react to the same stimuli in the same manner, and the outcome will be the same. The game, even when “Fiat money” finally meets its end, will be the same. Scare the masses, force them to stampede and then come in and buy everything for next to nothing.
Fear is a useless emotion
Fear is the weapon the top shadow players use with laser-like precision, and they know exactly how to elicit a reaction from the masses. The only antidote is to alter the angle of observance, and view fear as an opportunity. Only the herd gets butchered; the individual player who marches to his drumbeat can ride on the coattails of these big players.
However, tomorrow is based on today; if you know what is happening today, you have a pretty good chance of identifying what will transpire tomorrow. The masses tend to focus on tomorrow without looking at what is taking place today; instead, they assume they know what is taking place today and use those assumptions to determine what will occur tomorrow. Market Update May 19, 2017
To understand trends, you need to focus on the now as opposed to looking at a future event. Future events are shaped by what is going on today and not the other way around. If you can spot what is going on right now, you will be able to spot what the future holds. The solution is always simple; the hard part is to identify the problem.
For example, this is what we stated to our subscribers in June 2017
We issued the target of Dow 21K in Dec 2016, well in advance of the development. After the Dow traded to 21K, it has been doing practically nothing. The bulls and the bears are both trying to determine the future via fundamentals and or technical analysis and failing marvellously, we might add. What is taking place is very simple; the market (up to the present at least) has and is still going through a silent correction. This correction could become more vocal towards the last stage, and we are pretty close to the last stage of this correction. The market has been trending sideways, which is one of the ways a market can let out a huge dose of steam while making it appear that it has not shed anything.
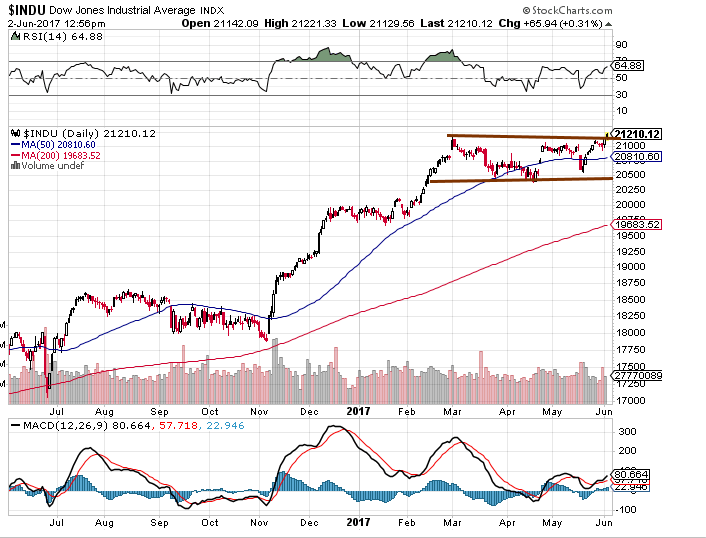
The chart illustrates how the Dow is trending sideways (tight channel formation) while several technical indicators (one of which is shown in the above picture) are trading in the oversold ranges. This is what a silent correction looks like and typically, the resultant move is usually up. The ideal set up, as we have stated many times, would be for the Dow to shed 1000 points quickly over a few days. The trend for the Dow and SPX is positive, so any strong pullback has to be viewed through a bullish lens.
2017 was interesting, and 2018-2019 period could prove to be interesting too
2017 is turning out to be a very interesting year; nothing that should be is, and everything that shouldn’t be is coming to pass. The stock market is a perfect example of this; the higher the market trends, the more nervous the crowd becomes. In a normal world, the opposite would hold true. Market Update May 19, 2017
When you look at the above chart and the charts below, the crowd’s reaction to this bull market differs from almost every other bull market in history.
What Was The TI Dow Theory saying back in 2017
In the last update, we confirmed that several Dow stocks, such as APPL, HD, DIS and NKE, all confirmed that the Dow has the potential to run a lot higher. We also looked at over 150 random stocks; over 60% of them were trading in the oversold ranges on the monthly charts. This market is now a stock picker; in other words, you cannot just buy any stock and hope it will trade higher because the trend is positive. A lot of stocks are going to experience crash-like symptoms as the market surges to new highs.
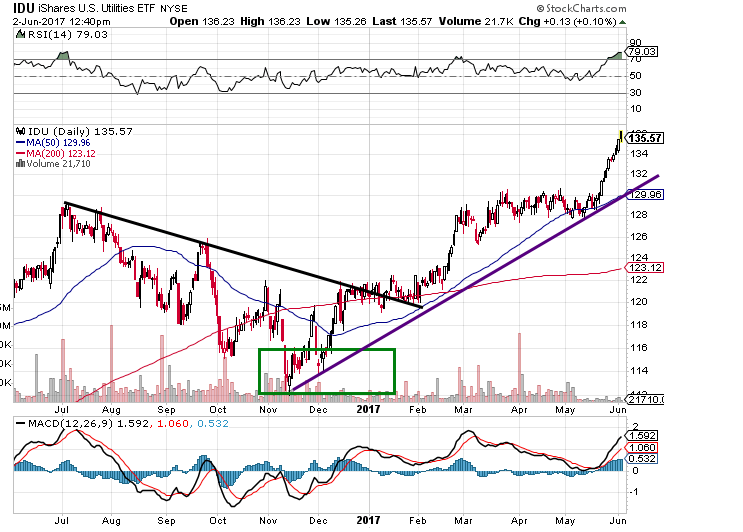
Our theory has always been that the Utilities lead the way and not the transports; that’s why several years ago we penned our first article openly stating that the Dow theory was dead. And the utilities have lived up to expectations; they predicted the market direction far more accurately than the Dow transports have over the past nine years.
Notice that the utilities experienced a correction from June 2016 to Nov 2016 and then reversed course. As they lead the way up and or down, the consensus would be for the Dow and Transports to correct or consolidate. At the moment that is exactly what the markets are doing. Market Update May 19, 2017
Two Interesting S&P 500 ETFs (March 2020 Update)
The first one is SPY and it’s meant for investors that prefer to trade the indices.

The second one is a leveraged one and suitable for traders willing to take on more risk.
The best time to buy ETFs and Stocks is when
There is blood in the streets, and the masses are running around like headless chickens, which just happens to be now. The coronavirus pandemic has created a buying opportunity of epic proportions
Just 15 days ago, people would have eagerly welcomed the current prices, but now, after 15 days, many are ready to give up. The volatility is expected to persist until the end of the month, particularly due to the significant surge in V readings, which soared by a staggering 650 points, reaching an all-time high. It’s worth contemplating the fact that the Federal Reserve has lowered rates by 150 basis points within a span of two weeks, which is an extraordinary development, yet it has been overshadowed by the current wave of hysteria. As we mentioned previously, companies are likely to aggressively pursue their share buyback programs.
Once the panic subsides, it will create an unprecedented feeding frenzy. The combination of zero interest rates, a two trillion dollar injection by the Federal Reserve, and several billion-dollar stimulus packages aimed at boosting the economy will propel the market to extraordinary heights that are difficult to fathom at present. Additionally, the zero interest rates will force a significant number of individuals with fixed incomes to venture into speculative investments, as they possess substantial cash reserves on the sidelines.
Insiders have been capitalizing on this substantial market pullback by purchasing shares. The sell-to-buy ratio is a useful indicator of the intensity of their buying activity. A reading of 2.00 is considered normal, while below 0.90 is regarded as exceptionally bullish. Currently, the ratio stands at a staggering 0.35, indicating that insiders are enthusiastically buying shares.
As for today’s readings, based on the high transaction volume, Vickers’ benchmark NYSE/ASE One-Week Sell/Buy Ratio is 0.33, and the Total one-week reading is 0.35. Insiders are not simply buying shares; they are voraciously devouring them. Insiders have exhibited similar behaviour in the past, such as in late December 2018 after the Christmas Eve stock crash, in early 2016 during a market correction, and in late 2008/early 2009 during the depths of the Great Recession correction. Those were remarkable times to buy stocks. Insiders appear to be suggesting that the present moment offers a similar opportunity. https://yhoo.it/2TV0cE2
The Crowd is Gripped By Fear
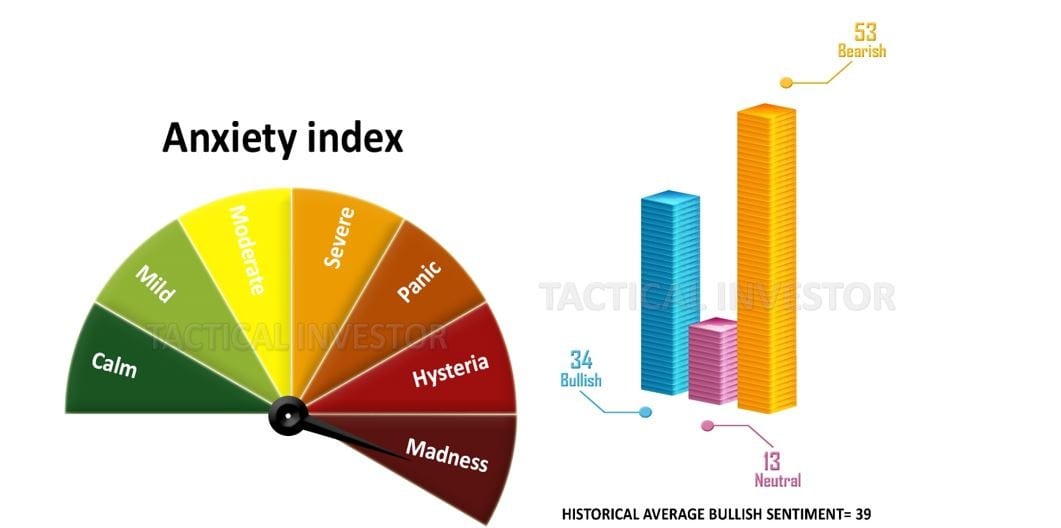
If you are an astute investor, then you have to look at the current level of hysteria through a bullish lens. The stronger the deviation, the better the buying opportunity.
Additional Notes
Mass Psychology clearly states that following the crowd is a recipe for disaster; their only function is to serve as cannon fodder. They claim to want change, but the moment they are given the chance, they give in to fear and repeat the same cycle again. Watch Plato’s allegory of the cave it is a perfect example of the mass mindset in action.
Other Good Reads
Risk and Opportunity; When To Buy & When To Run (Nov 28)
Risk To Reward Ratio & Opportunity Vs Risk (Nov 27)
A clear illustration of why we often refer to experts as jackasses (Nov 15)
Stock Market Bull 2018 Doldrums; is the Bear Ready to Growl (Oct 28)
The Ideal time to Buy Stocks is when the Masses are Panicking (Oct 27)
Trade is not that important to America as it’s a closed Economy (Aug 3)
US dollar index chart Bullish: Dollar Expected to trend higher in 2018 (Aug 2)
