
Some people drink deeply from the fountain of knowledge. Others just gargle.
Grant M. Bright, British-born American Engineer
Uranium Spot Price Chart: Shaping Supply, Demand, and Prices
Updated Dec 31, 2023
Uranium, the lifeblood of nuclear power, is witnessing a significant shift in its market dynamics. A confluence of factors is reshaping the uranium price and supply landscape, hinting at a potential upswing in its value.
Historically, the uranium market has weathered stress, primarily due to inadequate investment in new production capacity. This underinvestment resulted from the low uranium prices after the Fukushima disaster. The concentration of mines in specific geographic regions further compounded this issue, creating a natural delay in introducing a new primary supply. Recent geopolitical events and disruptions induced by the COVID-19 pandemic have added another layer of complexity to the supply landscape.
On the demand side, nuclear power is a cornerstone in the global clean-energy strategy, which is steadily gaining momentum. Projections suggest that global energy consumption will nearly double over the next two decades, fueled by rapid population growth and economic expansion. With the world’s pursuit of carbon-free energy sources, nuclear power is well-positioned to meet the need for baseload power, thereby driving up the demand for uranium.
Moreover, advancements in Small Modular Reactor (SMR) technology have expanded the scope of nuclear power applications beyond electricity generation. These applications include water desalination, hydrogen production, and heat generation. This diversification is expected to further boost the demand for uranium in the foreseeable future.
As we delve deeper into the 21st century, the uranium market continues to evolve. The advent of Fourth Generation nuclear reactors, which promise higher efficiency and safety, could further stimulate uranium demand. Additionally, the global push towards decarbonization and the Paris Agreement’s ambitious climate goals have placed nuclear power and uranium at the forefront of the energy transition.
The uranium spot price chart is not just a reflection of current market dynamics but also a predictor of future trends. It’s a barometer of the delicate balance between supply and demand, geopolitical influences, technological advancements, and environmental considerations. As such, it is a crucial tool for investors, policymakers, and industry stakeholders.
In conclusion, the uranium market is at a crossroads, shaped by many factors ranging from supply constraints to burgeoning demand and technological innovations. As we navigate this complex landscape, the uranium spot price chart serves as our compass, guiding us through the intricate interplay of forces shaping the future of uranium.
Illuminating Rare Trends: Uranium Spot Price Long-Term Shifts
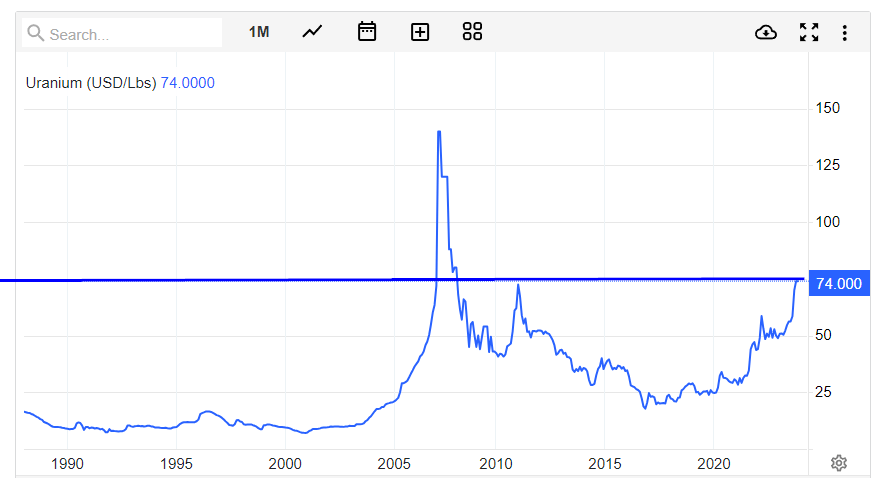
Source: www.tradingeconomics.com
Uranium is painting a striking and formidable pattern, shattering all zones of prior resistance. The key lies in a monthly close above 75, preferably 78, to pave the way for a journey to 141 and beyond, reaching new all-time highs. From a long-term perspective, investors should eagerly anticipate sharp pullbacks, seizing the opportunity to buy when they materialize.
Analyzing the Uranium Spot Price: The Monthly Outlook
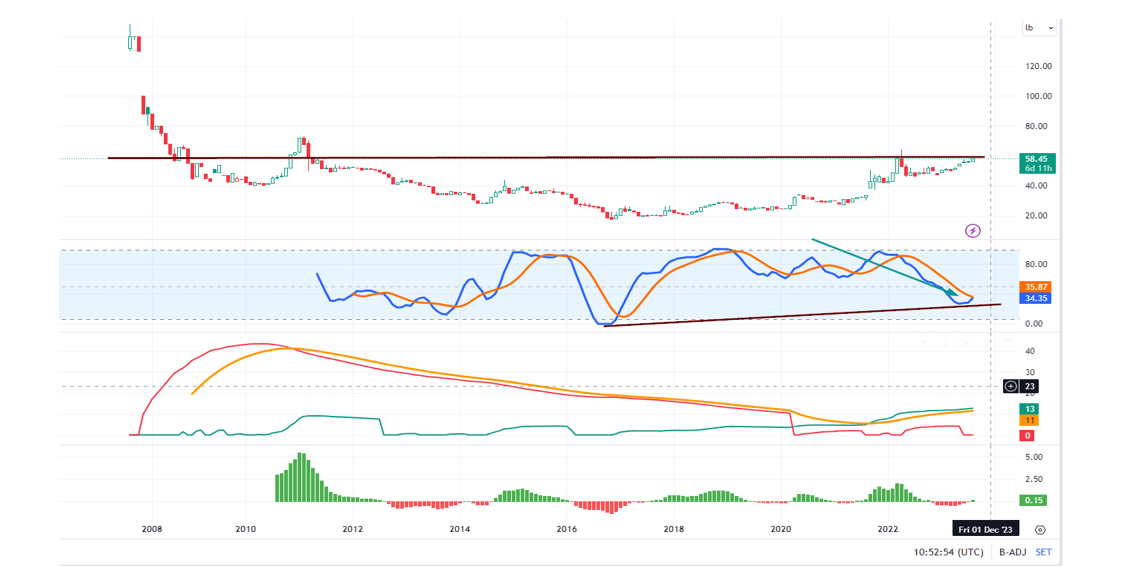
The uranium sector shows an intriguing pattern that has captured our attention. If this pattern unfolds as anticipated, it could create a new and significant trend.
This pattern is fascinating because Uranium is currently challenging resistance levels that have persisted for a long time. At the same time, the technical indicators suggest that the market is oversold. Considering all these factors, it becomes evident that Uranium is on the verge of a significant upward movement, with the potential to surpass the $120.00 mark before this upward cycle concludes.
Analyzing the Uranium Spot Price: A Weekly Outlook
The weekly uranium spot price chart outlook suggests that uranium (the metal) is trading in highly overbought territory. However, it could intensify its upward trend cycle if it achieves either of the following conditions before undergoing a pullback: securing a weekly close at or above 58.75 or experiencing a surge to new highs, which would necessitate surpassing the 63.85 threshold.
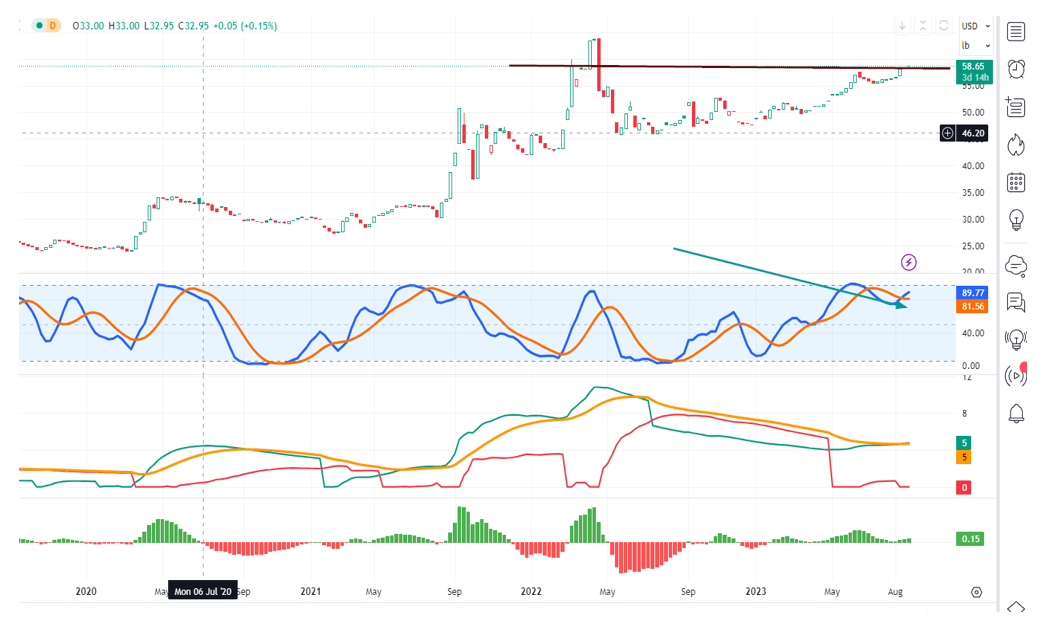
Should it fall short of these objectives, there will be no alterations. The long-term perspective remains profoundly bullish. As previously mentioned, the only variable that might be affected is the speed at which it tests and surpasses the 120.00 level.
Conclusion
The uranium market is at a pivotal juncture, experiencing a remarkable transformation in response to various market forces. The challenges it has faced, including underinvestment, geographic concentration of mines, and supply disruptions, have created an environment of uncertainty and complexity.
On the demand side, nuclear power is gaining prominence as a key component of the global clean-energy strategy, driven by the need for baseload power to meet the rising global energy consumption. Additionally, advancements in Small Modular Reactor (SMR) technology are expanding nuclear power applications, further bolstering uranium’s demand outlook.
As we analyze the uranium spot price charts, both monthly and weekly, we see intriguing patterns that hint at significant potential. Uranium is poised to challenge long-standing resistance levels, and technical indicators suggest an oversold market. This combination of factors indicates the possibility of a substantial upward movement, with the potential to surpass the $120.00 mark in the near future.
In essence, the uranium market is on the cusp of a transformative journey driven by shifting dynamics in both supply and demand. The path ahead holds promise, and careful observation of market trends will be key to navigating this evolving landscape successfully.
Moving forward, we will analyze the price action in the context of historical data. This allows us to review our real-time decisions and reminds us that failing to learn from history can lead to its repetition.
Uranium Spot Price: The Stealth Uranium Bull Market
A brief glance at this chart reveals that uranium has a considerable distance to cover before reaching the highs set in 2006. The genuine bullish phase is anticipated to commence when these previous highs are surpassed. Without this achievement, one could make a technical argument that the current uptick is merely a temporary recovery within a long-term secular bear market.
Our perspective is grounded in believing this market still holds substantial untapped upside potential. A key factor contributing to this optimism is the relatively limited public attention it has received thus far. While the topic occasionally surfaces, it has yet to become the focal point of mainstream discussion.
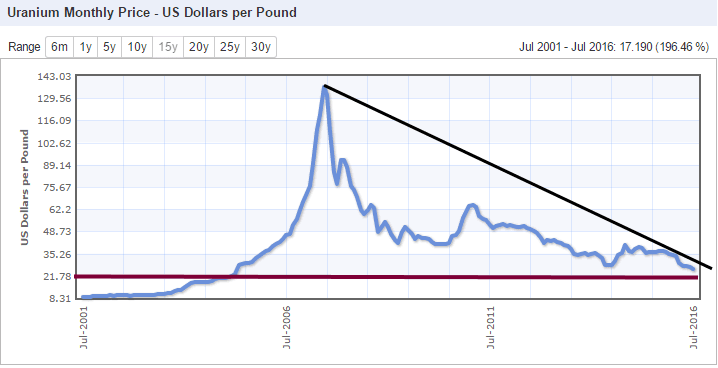
Source:www.indexmundi.com/
Strategic Approach to the Uranium Market: Navigating Mass Psychology for Success
We will approach this market differently. When uranium finally reaches the front pages of major magazines and newspapers, many will rush to bail out. However, this won’t be the ideal time to exit at TI, where we heavily focus on mass psychology. At this stage, we expect a mass feeding frenzy to begin, leading to a highly volatile ride upward that could yield additional gains of up to 500%. We plan to ride this wave until our psychological indicators indicate that bullish sentiment has reached an unsustainable level, and then we will strategically exit the market.
As we’ve emphasized in the past, every potentially significant sector is filled with exciting opportunities, but it’s crucial to know when to position oneself in these opportunities. Today’s leaders may not be tomorrow’s leaders, and some stocks may ultimately end up as losers. For instance, consider MYNG in the Gold Sector; despite reaching a high of 30 cents in October 2003, it’s now trading at just 1 cent, even as gold has gone on to achieve a series of new 52-week highs.
Uranium Spot Price & Bull Market Update Aug 2018
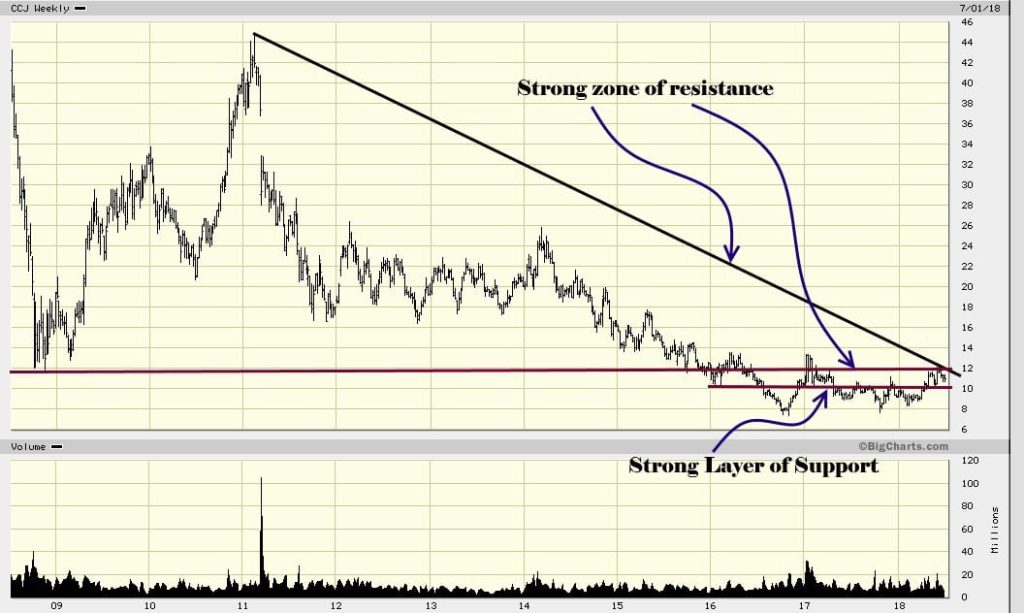
CCJ’s recent drop to and below $8.50 presented a significant opportunity for those who followed our suggestions. Now, let’s examine the outlook for uranium.
The weekly chart above shows that CCJ is approaching a robust resistance zone. If it manages to close above $12 on a monthly basis, the previous resistance will transform into support, opening the path for a potential climb to multi-year highs. A monthly closing above $12 could also set the stage for CCJ to reach the $20 range, possibly even overshooting to $26.00.
Sharp pullbacks can be opportune moments for savvy investors to establish positions in strong stocks like CCJ. Remember, in the investing world, it’s often said that “the trend is your friend,” while everything else can pose challenges.
The need for expansion is as genuine an instinct in man as the need in a plant for the light, or the need in man himself for going upright. The love of liberty is just the instinct in man for expansion.
Matthew Arnold 1822-1888, British Poet, Critic
Discover Unique and Valuable Articles for Your Interest

Investor Sentiment in the Stock Market: Maximizing Its Use

A Crisis of Beliefs: Investor Psychology and Financial Fragility

Copper ETF 3X: Rock On or Get Rolled Over

Which of the Following Is True of Portfolio Diversification?

What is the Average Student Loan Debt in the US? Understanding the Crisis

Student Debt Crisis Solutions: Halting the Madness is Essential

Dogs of the Dow 2023: Howl or Howl Not?

Navigate Student Loans: Discover, Settle, Excel

Early Retirement Extreme Book: Dive into the Facts, Skip the Book

What Is Blue Gas? Unveiling the Energy Mystery

From Student Loans to Financial Freedom: A Post-Graduation Roadmap

How do savings bonds work after 20 years?

In Which Situation Would a Savings Bond Be the Best Investment to Earn Interest?

Which Type of Account Offers Tax-Deferred Investing for Retirement?

How to Start Saving for Retirement at 35 and Ensure a Comfortable Future
