
Deciphering the Baltic Dry Index Chart
Updated Jan 27, 2024
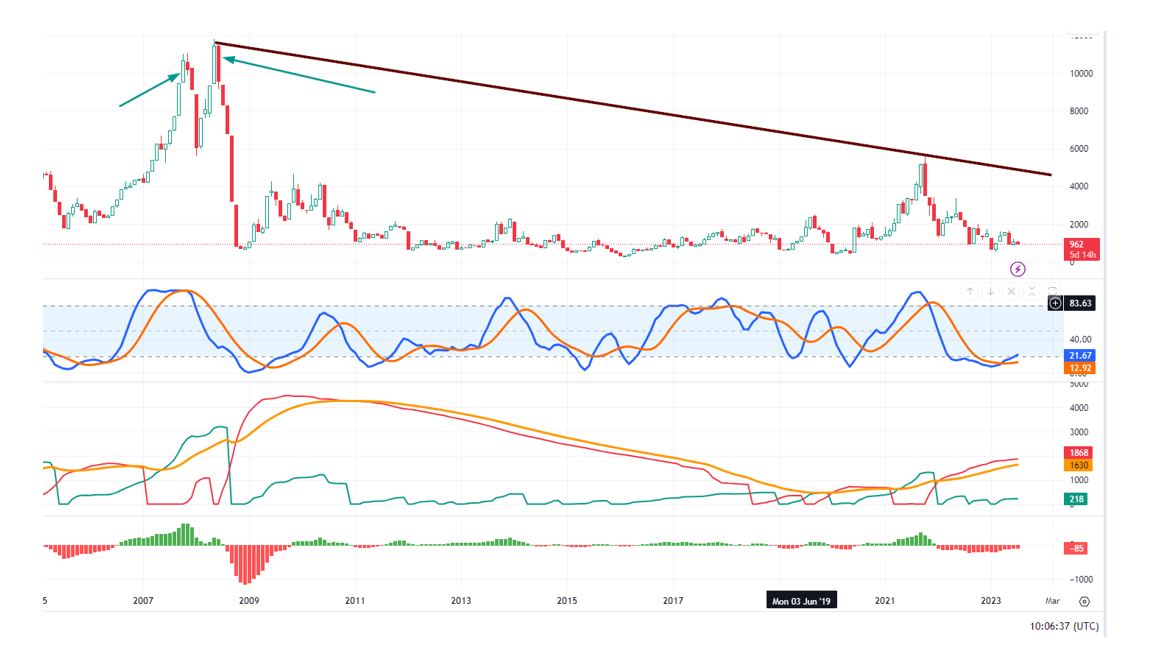
Examine the Baltic Dry Index Chart Displayed Below. Despite Greenspan’s efforts to inject money into the system, the amounts were insufficient to alter the landscape significantly. How can we deduce this? The BDI continued surging to new highs until May 2008, when that trend abruptly stopped. What caused this? Free market forces were extinguished.
The BDI’s indication is clear: the US economy, and by extension, most Western-based economies, have never truly recovered. The patient is ailing and should have perished, but it is being artificially sustained through massive infusions of chemicals (in this case, cash) to extract as much as possible from the system. Real-time inflation, not the misleading data issued by the Fed and the BLS (Bureau of Labour Statistics), soared after that period.
Suppose one examines the economies of most Western countries. In that case, it becomes apparent that wealth revolves around the stock market, with many companies producing little in the way of tangible products – things essential for survival, such as food, energy, and basic medicines.
Taking a broader perspective, it becomes evident that despite the numerous cash infusions into the economy, the Baltic Dry Index (BDI), a prominent economic indicator, continued its upward trend until it peaked in 2008. Subsequently, even with trillions of dollars added to the system, the BDI performed like a sick creature.
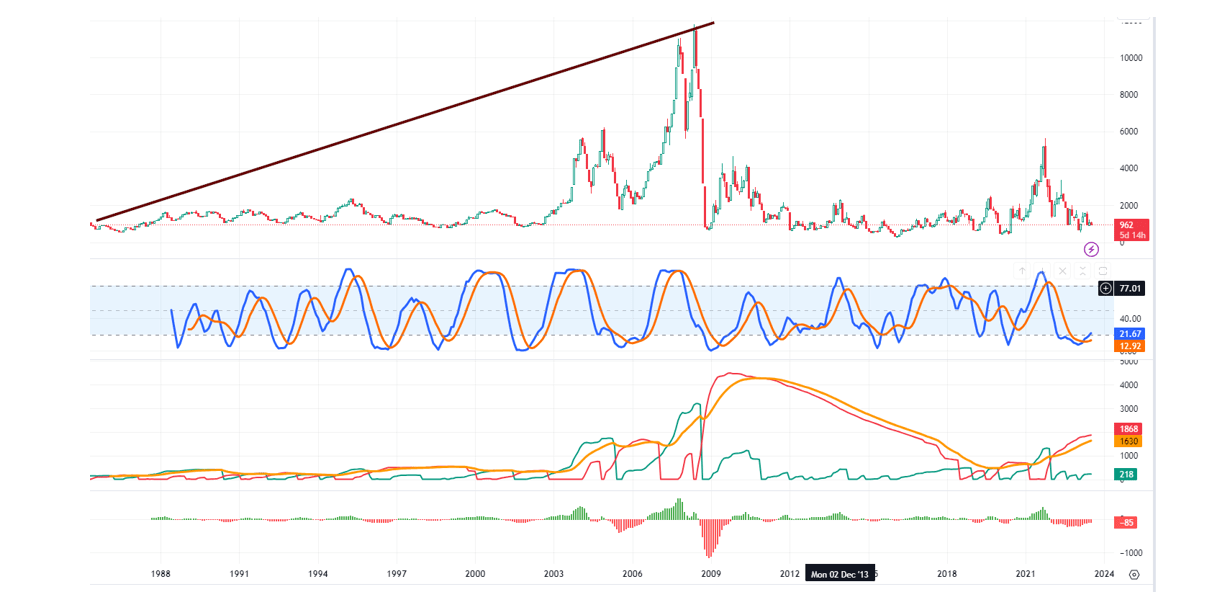
Baltic Dry Index Chart: Tracking Trends from 1988 to 2023
In May 2008, it achieved a high of 11,793. The next peak occurred on October 4, 2021, reaching 5,650, after the US injected 5 trillion dollars to address the COVID-19 crash. This fact is worth pondering: despite this massive infusion of cash before and after 2009, the BDI could not recover even 50% of its losses. This indicates that the BDI has been in a bearish state since 2008, and the global economic recovery is nothing more than an illusion, albeit an elaborate one.
In essence, this chart forewarns that, at some point, the consequences of our actions will catch up to us, resulting in an event reminiscent of the 1929 crash, wherein immense wealth will be obliterated. Our only recourse against this impending disaster lies in continuously monitoring the psychology of crowds and world governments.
Harnessing the Baltic Dry Index (BDI) for Strategic Market Entry and Exit
The Baltic Dry Index (BDI) is a powerful economic barometer that offers a real-time glimpse into the global economy’s pulse. It gauges the cost of transporting primary raw materials, making it highly responsive to shifts in global commodity demand. This sensitivity makes the BDI a potentially effective tool for identifying strategic market entry and exit points.
The BDI’s trajectory from 1985 to 2023 paints a compelling picture. Despite the global economy being flooded with liquidity, the BDI reached its zenith in May 2008 and has been on a downward trajectory since. This trend suggests that the much-touted global economic recovery might be more a mirage than a miracle.
The BDI’s strength lies in its ability to mirror real-time inflation and economic activity. For example, despite the U.S. pumping $5 trillion into the economy to mitigate the COVID-19 crash, the BDI failed to recoup even half of its losses. This suggests that the BDI might offer a more accurate economic snapshot than traditional measures.
Leveraging Copper as a Leading Indicator to Enhance Market Timing
Copper, often called “Dr. Copper” in investment circles, is another leading economic indicator that can be used alongside the BDI. Copper’s extensive use across various industries makes its price highly responsive to changes in economic activity.
When the economy is robust, demand for copper increases as industries expand, pushing up its price. Conversely, when the economy contracts, demand for copper decreases, leading to a drop in its price. Therefore, tracking copper prices can provide valuable insights into the economy’s health and help identify potential market entry points.
For instance, a rise in copper prices and a rising BDI could signal a strengthening economy and a potentially good time to enter the market. On the other hand, falling copper prices and a declining BDI could indicate an economic slowdown and a potentially good time to exit the market.
However, it’s important to remember that the goal is not to time the market perfectly but to enter at the most advantageous periods. The BDI and copper are tools to help investors make more informed decisions. They should be used with a comprehensive investment strategy that considers various factors, including individual financial goals, risk tolerance, and market conditions.
Conclusion
While the Baltic Dry Index chart suggests long-term economic concerns, the stock market disregards this. The index hasn’t come close to its May 2008 highs, and inverted yield curves in many countries haven’t affected the market yet.
However, it’s worth noting that recessions typically begin 6 to 24 months after the Fed stops hiking rates. The last significant rate-hiking cycle started in the summer of 2004, with 17 hikes of 25 basis points each, reaching 5.25%.
The subsequent bear market and the stock market crash didn’t happen immediately. The debt and equity markets were strong even a year after the final Fed hike in June 2006. Signs of trouble only emerged in late 2007, with things falling apart in 2008.
Prudent investors should shift from FOMO stage stocks to NCA (Nobody Cares About) stage ones. A market crash is unlikely until bullish sentiment reaches and stays at 60 for two consecutive weeks.
While market volatility is expected, we anticipate the next pullback will be a buying opportunity. Bullish sentiment dropping below its historical average of 38.5 for two consecutive weeks supports the idea that markets will trend higher post-pullback.
Captivating Articles That Leave a Lasting Impression

Investor Sentiment Index Data: Your Path to Market Success

Unraveling Market Psychology: Impact on Trading Decisions

Is Value Investing Dead? Shifting Perspectives for Profit

Dogs of the Dow 2024: Barking or Ready to Bite?

What happens when the stock market crashes? Opportunity!

The Trap: Why Is Investing in Single Stocks a Bad Idea?

How Can Stress Kill You? Unraveling the Fatal Impact

Clash of Titans: Unleashing Inductive vs Deductive Reasoning

Financial Mastery: Time in the Market Trumps Timing

Investment Pyramid: A Paradigm of Value or Risky Hail Mary?

Contrarian Investing: The Art of Defying the Masses

Quantitative Easing: Igniting the Corruption of Corporate America

Uranium Market Outlook: Prospects for a Luminous Growth Trajectory

Stock Investing for Kids: Surefire Path to Success!

An Individual Who Removes the Risk of Losing Money in the Stock Market: A Strategic Approach
Profit Surge Unleashed: Mastering the Craft of Selling Puts for Income
