
Sep 26, 2022
An examination of any Market crash history reveals one stunning fact. Investors that jumped in and bought when panic was running high fared 10X better than those that dumped their shares. One helpful gauge investors can use to monitor bearish sentiment. When over 60% of investors are bearish, the risk-to-reward moves into your corner. At that point, it makes sense to jump into top-rated companies aggressively.
Stock market crash history also reveals that Technical analysis can help play a pivotal role in fine-tuning entry points. A bottom usually corresponds to a highly oversold condition. When the monthly charts are trading in highly oversold ranges, it’s an excellent time to deploy some cash. Hence if the monthly charts are trading in the highly oversold zones and bearish sentiment is at or close to 60, you have almost a perfect long-term entry point.
Market crash history: 1973 to 1974 timelines
The developments that occurred during the above timeline are similar to what is happening now.
1973 oil crisis
An ongoing war (Vietnam war). While a cease-fire was agreed on January 23, 1973, the war did not end until early 1975.
Self-inflicted Highly inflationary period
Erratic president. Nixon desperately did not want to be the 1st president to lose a war.
The Vietnam War and the Russian War
In its swift swings between lull and violence, hope and despair, the Viet Nam War has often had a manic character to it. Never more so than in the latest extraordinary episode in which, within the space of 40 days, the World moved from a sense of peace at last at hand, to the most brutal U.S. bombing of the war, to Washington’s declaration late last week that the secret Paris peace talks would begin again on January 8. Rarely if ever, before had a major power so openly used overwhelming force to extract concessions at the conference table, or moved so swiftly from diplomacy to war and back; the episode almost evoked the end of the Thirty Years’ War, when fighting and negotiating accompanied each other in a dizzying blur. The news of the bombing halt was as puzzling as it was welcome,
Brutal acts of violence
Those acts of escalation, embodied in daily waves of U.S. bombers aimed at Hanoi’s heartland over a period of two weeks, had left the capital of North Viet Nam a stricken city, rapidly emptying of people, without electricity and in some places water, many of its streets and even whole quarters smashed and cratered by the ferocity of daily U.S. bombing raids. Once neat one-story houses lay flattened or lurched at odd angles, roofless and windowless. On one street, a young worker in a red helmet stared numbly into a pit that was once his home. In it lay children’s shattered copybooks, a dead black hen, and a mosquito net still hanging from an upright beam on one end.
On another street, relief crews tugged at the corpse of a dead nurse, buried under her blasted dispensary. An old man stood amid the ruins of his home, mechanically putting on his coat and taking it off as though the simple ritual might restore his past.
Children searched among the debris looking for parents, parents for children. At the Bach Mai hospital, patients were trundled piggyback from the smoldering rubble as the director ran frantically from one victim to another. The Bach Thai hospital for tuberculous patients was razed. The railroad station had been destroyed, the Gia Lam airport runways pocked. Stacks of coffins lay at street corners. Here and there on a wall, someone scrawled, “Nixon, you will pay this blood debt” and “We will avenge our compatriots massacred by the Americans. https://cutt.ly/TLqe26r
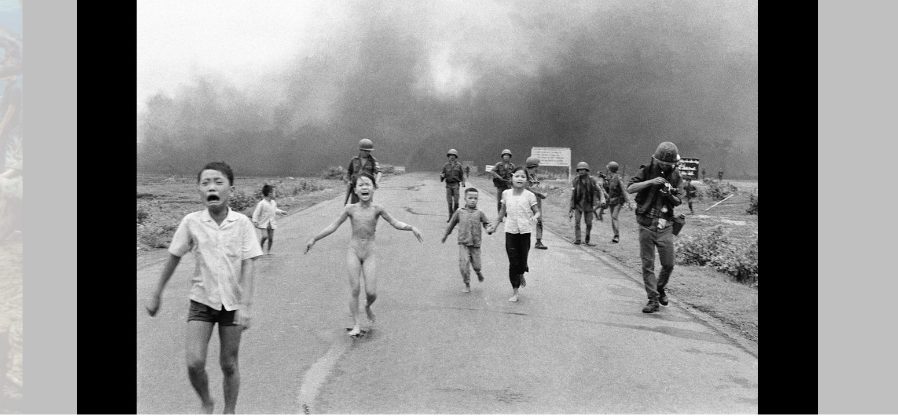
Terrified Children Running:
Associated Press photographer Nick Ut photographed terrified children running from the site of a Vietnam napalm attack in 1972. A South Vietnamese plane accidentally dropped napalm on its own troops and civilians. Nine-year-old Kim Phuc, centre, ripped off her burning clothes while she ran. The image communicated the horrors of the war and contributed to the growing U.S. anti-war sentiment. After taking a photograph, Ut took the children to a Saigon hospital. https://cutt.ly/cLqtFVN
Manflation
All the things mentioned during the 1973- 1974 timelines are taking place Today: from the Russian-Ukraine war to the MANFLATION experience.
It appears that a bottom is in place, and the SPX is on course to challenge the 4200 to 4500 ranges. Market Update June 29, 2022
Several stocks, some of which are mega-players, bottomed in advance of the major indices; GOOGL, AMZN, IBM, JNJ, VZ, SBUX, BABA, BIDU, etc. Some Chinese stocks/ETFs exhibited powerful positive divergence signals; the following four come to mind, BABA, FXI, BIDU, D.Q., etc., indicating all these chaps should outperform the markets.
The market rallied consecutively for three-plus days on excellent “UP” volume.
Bullish sentiment is below its historical average for several weeks on end. It has been trading below 20 for almost five weeks in a row.
The anxiety index has been in the extreme zone for months on end
Technically the markets are trading in the oversold ranges on the monthly charts and insanely oversold on the weekly charts.
The above factors have triggered the first buy. However, for stronger buy signals to be triggered by the individual indices, the following would need to occur.
Dow: Weekly close above 31,500
NDX: It would need to close above 12540 on a weekly basis and preferably twice. Or end the month at or above 12490
SPX: A weekly close above 3951
In 1973 the markets pulled back, then bottomed roughly in August and rallied until October, then the second and more destructive corrective phase began, which lasted until December 1974. After that phase ended, the markets mounted a powerful rally that lasted roughly until September 1976. However, no MOAB or FOAB was triggered, and the money supply was tiny compared to the mega boatloads of hot money sloshing around Today.
Conclusion
Certain Chinese stocks appear unusually strong, BIDU, BABA, DQ, JD and FXI. If a second buy signal is generated, the markets should rally to Sept/Oct.
If the 1973 to 1974 pattern completes, the chances of the Mother of all buys (MOAB) being triggered will be close to 90%. And if The Kansas City Financial Stress Index (KCFSI) matches the high it set in 2008-2009, then the odds of the very rare FOAB being generated will be north of 81%, which is almost as good as 100%; to get 81% a lot of factors have to coalesce almost perfectly. A stock market crash history study reveals that one should buy when fear is running high and sell when the masses are euphoric.
Research
These articles provide insights and tips on investing wisely during a market crash and why buying during a market crash can be a good strategy for long-term investors.
- “Why a Stock Market Crash Can Be Good News for Investors” by Investopedia (https://www.investopedia.com/articles/investing/030216/why-stock-market-crash-can-be-good-news-investors.asp)
- “Why a Stock Market Crash Is a Good Time to Buy” by U.S. News & World Report (https://money.usnews.com/investing/investing-101/articles/why-a-stock-market-crash-is-a-good-time-to-buy)
- “Market Crashes: Is it Time to Buy?” by Charles Schwab (https://www.schwab.com/resource-center/insights/content/market-crashes-is-it-time-to-buy)
- “Why a Market Crash Can Be a Good Time to Invest” by Vanguard (https://investornews.vanguard/why-a-market-crash-can-be-a-good-time-to-invest/)
Other Articles of Interest

Blooms and Busts: Navigating the Tulip Bubble Chart Phenomenon

Herd Mentality: Understanding the Pros and Cons of Conformity

Projected Silver Prices: Setting Sail for Precious Metal Ascension

Which Of The Following Is A Cause Of The Stock Market Crash Of 1929

Stock Bubble: Act Quickly or Lag Behind

The Dow Theory: Does It Still Work?

Tactical Tools: Unleash the Power of Trend Prediction

The Pitfalls of Investing: Why People Lose Money in the Market
Stock Market Tips For Beginners: Surfing the Trends for Success

Panic Selling Mastery: Buying the Fear & Selling the Joy

Catch the Wave: Decoding Trading Cycles with the Esoteric Edge

Are Economic Indicators Finally In Sync With the Stock Market

Perception Manipulation: Mastering the Market with Strategic Insight
Market Uncertainty: A Challenge for Investors