
What Does the Silver to Gold Ratio Tell Us
Updated March 2023
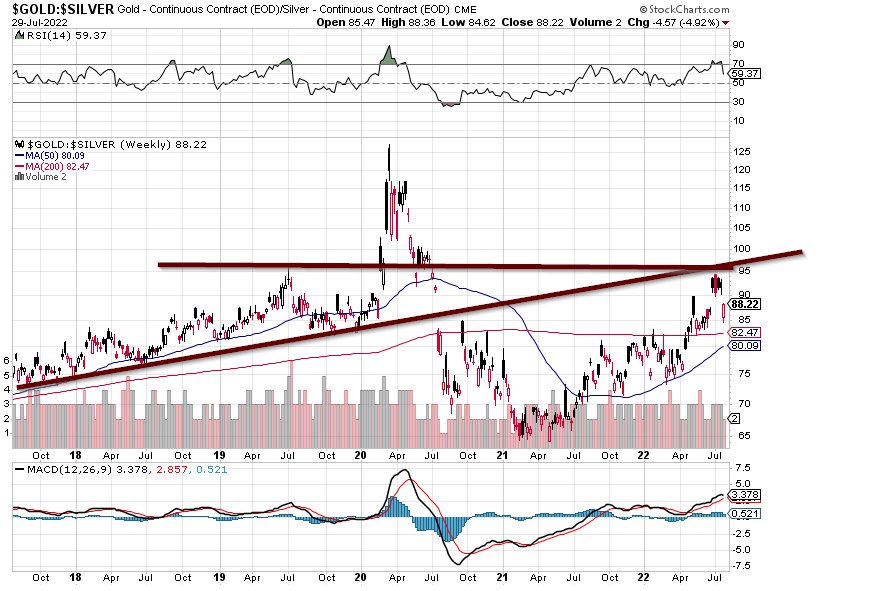
The ratio is rising, and it breaks past 95 and tests the 99 to 110 range. Silver could experience a rapid move. From April 2020 to Aug 2020, SLV rose by almost 100%
The ratio is a financial metric comparing silver’s price to gold’s. It is calculated by dividing the current price of gold per ounce by the current price of silver per ounce. The ratio provides insights into the relative value of silver compared to gold and can be used by investors and analysts to assess market trends and make investment decisions. Here are a few key points about the silver-to-gold ratio:
1. Relative Value: The ratio helps determine the relative value of silver compared to gold. A higher ratio indicates that silver is relatively cheaper than gold, while a lower ratio suggests silver is more expensive than gold.
2. Market Sentiment: The ratio can provide insights into market sentiment and investor preferences. When the ratio rises, it may indicate increasing investor interest in silver, potentially driven by industrial demand, inflation concerns, or speculative trading. Conversely, a declining ratio may suggest a preference for gold as a safe-haven asset or a more favourable outlook for the gold market.
3. Historical Comparison: Analyzing the historical trends of the silver-to-gold ratio can provide helpful information. Some investors and analysts track the ratio over time to identify periods of overvaluation or undervaluation of silver compared to gold. Extreme deviations from historical averages may be seen as potential opportunities for rebalancing portfolios or making investment decisions based on the expectation of a reversion to the mean.
4. Volatility and Market Conditions: The ratio can be influenced by various factors, including supply and demand dynamics, economic conditions, geopolitical events, and investor sentiment. Changes in these factors can cause fluctuations in the ratio, making it a potentially volatile metric. Considering the broader market context and conducting a thorough analysis before drawing conclusions solely based on the silver-to-gold ratio is essential.
.
Inflation
Inflation should peak shortly; the latest CPI reading will likely coincide with a peak. However, inflation will reappear when the dollar peaks in 2023. The current inflation falls more under the MANFLATION category (purposely nurtured and fostered by man). The next dose will be the real deal, as it will coincide with a dollar top.
Bonds
On the weekly charts, bonds are trading in the “insanely” oversold ranges. They are primed to move higher and are looking for any reason to mount an explosive rally. Barring a black swan event, this should come to pass. In this scenario, bonds will likely trade in the 144 to 149.40 range; the ideal target falls in the 145 to 147 range.
NIKKEI 225 Index
It is also projected to be at a lower high in September-October. However, if it tops out before any major index in the US (DOW, NAS, Russell), it should be construed as an early warning signal that a top in the US markets is imminent.
The Significance of a Rising Ratio for Investors
The ratio is essential for investors interested in precious metals. The ratio compares the price of silver to that of gold, and it is often used as an indicator of market sentiment towards these two metals. Over 2021, the silver-to-gold ratio has increased, which has important implications for investors.
The ratio measures the ounces of silver to buy one ounce of gold. For example, if the price of gold is $1,500 per ounce and the cost of silver is $15 per ounce, the silver-to-gold ratio would be 100. In other words, buying one ounce of gold would take 100 ounces of silver.
Over the 2021 year, the silver to gold ratio has been steadily increasing. At the start of 2020, the ratio was around 85, meaning it took 85 ounces of silver to buy one ounce of gold. By mid-March, the ratio had risen to 120 as the COVID-19 pandemic sent shockwaves through the global economy, and investors flocked to safe-haven assets like gold. Since then, the ratio has remained elevated and currently stands at around 75.
What does the rising Silver/Gold ratio mean for investors?
There are a few key takeaways. First, it suggests investors are becoming more optimistic about the global economy. As the ratio declines, investors are more willing to take on riskier assets like stocks and are less interested in safe-haven assets like gold. Conversely, investors become more cautious as the ratio rises and turn to safe-haven assets like silver.
Another key implication of the rising silver-to-gold ratio is that it may signal an opportunity for investors to add silver to their portfolios. Silver is relatively cheap compared to gold when the ratio is high, making it an attractive investment option. This is especially true for investors who believe the global economy is due for a downturn or recession, as silver tends to perform well during economic uncertainty.
The rising ratio indicates investor sentiment towards precious metals. While it may signal caution on the part of investors, it also presents an opportunity for those looking to diversify their portfolios and add exposure to silver.
Understanding the Silver-Gold Ratio and Its Implications for Investors
The ratio of the price of silver to the price of gold. It is used to measure the relative value of silver compared to gold. The ratio can be calculated by dividing the current price of gold by the current price of silver.
Historically, the ratio has been used by investors to indicate market sentiment and economic conditions. A high ratio, meaning that it takes more ounces of silver to buy an ounce of gold, is often seen as an indication of a weak economy. Silver is considered a more industrial metal, and its demand is more closely linked to economic activity. In contrast, a low ratio, meaning that it takes fewer ounces of silver to buy an ounce of gold, is often seen as an indication of a strong economy, as gold is a safe-haven asset during times of uncertainty and economic instability.
The ratio alone should not be the sole indicator of when to buy or sell either metal. Other factors, such as global economic conditions, supply and demand, inflation expectations, and geopolitical risks, can also impact the prices of both metals.
Silver to Gold: Contrarian Tactics & Market Sentiment Mastery for Perfect Investment Timing!
The ratio can be used in a contrarian and mass psychology perspective to time one’s buys by taking advantage of potential market inefficiencies and sentiment shifts. Here’s how:
Contrarian Perspective: Contrarian investors aim to go against the prevailing market sentiment and take positions opposite to the majority. In the ratio context, a contrarian approach involves looking for extreme deviations from historical averages or significant divergences from market expectations.
When the ratio reaches historically high levels, it suggests that silver may be undervalued compared to gold. This could be an opportunity for contrarian investors to consider buying silver, as the sentiment may have become overly bearish, and the price may not fully reflect its potential value. Contrarian investors believe that market sentiment tends to swing from extremes, and they seek to take advantage of these shifts by buying assets when they are out of favour and selling when they become overvalued.
Mass Psychology Perspective: Mass psychology refers to market participants’ collective emotions and sentiments, which can impact market trends and asset prices. The ratio can provide insights into mass psychology, as it reflects the preferences and sentiments of investors towards these precious metals.
When the ratio rises, it suggests that investors favour gold over silver, potentially driven by increased risk aversion or a more pessimistic outlook on the economy. In this scenario, contrarian investors may take a mass psychology perspective and consider buying silver. They would assume that the prevailing sentiment has become too negative towards silver and that a reversal in sentiment could lead to a potential increase in its value.
By combining the contrarian perspective with an understanding of mass psychology, investors can identify potential opportunities to time their buys in the silver market. They would look for situations where the ratio is at extreme levels or shows signs of sentiment shifts and consider taking positions against the prevailing sentiment.
Conclusion
There are a few key takeaways. First, a rising ratio suggests investors are becoming more optimistic about the global economy. When the ratio declines, investors are more willing to take on riskier assets like stocks, signalling increased confidence in economic growth. Conversely, as the ratio rises, investors become more cautious and turn to safe-haven investments like silver.
Another important implication of a rising ratio is that it may allow investors to consider adding silver to their portfolios. Silver is relatively cheap compared to gold when the ratio is high, making it an attractive investment option. This is particularly true for investors anticipating a downturn or recession in the global economy, as silver has historically performed well during periods of economic uncertainty.
The rising ratio between silver and gold reflects investor sentiment towards precious metals. While it may indicate caution on the part of investors, it also presents an opportunity for those looking to diversify their portfolios and gain exposure to silver. By analyzing the ratio and understanding its implications, investors can make informed decisions about their investment strategies and take advantage of potential opportunities in the market.
Published September 2022 and updated in March 2023
Other Articles of Interest

From Zero to Stock Market Hero: Stock Investing for Dummies PDF

Percentage of Americans That Own Stock: Unlocking the Data

Real Estate Investing for Dummies: The Straightforward Path to Building Wealth

Tantalizing Uranium Stocks Soaring: A Contrarian Perspective

Refinement and Riches: Uncover the Luxurious World of Financial Freedom Books

Wisdom in Reverse: Learning the Hard Way How to Lose Money in Stocks

Clear-Cut Investing: Distinguishing Fundamental Analysis from Technical Analysis

Market Psychology Chart: Tips for Informed Investment Decisions

Selling Covered Calls For Income: Elevate Your Income Strategy

Contrarianism: Capitalizing on Dissent in the Market Maze

Amazon Stock Direct Purchase Plan: A Comprehensive Guide

Copper ETF: The Great Investment Debate – Buy-In or Miss Out?

Palladium Price Trends: Unveiling the Allure of a Shining Investment

What is a Bullish Market: Debunking the Illusion of Stock Market Crashes