Behavioral Finance: 2nd Year Presidential Cycle Great For Stocks
With Democrats in charge of the house, we will have a lot of gridlock and markets love gridlock for it means the odds of an unpleasant surprise coming out of Congress is low. Secondly, the markets have generally performed very well in the third year of the presidential term and by a long shot. Take a look at the chart below
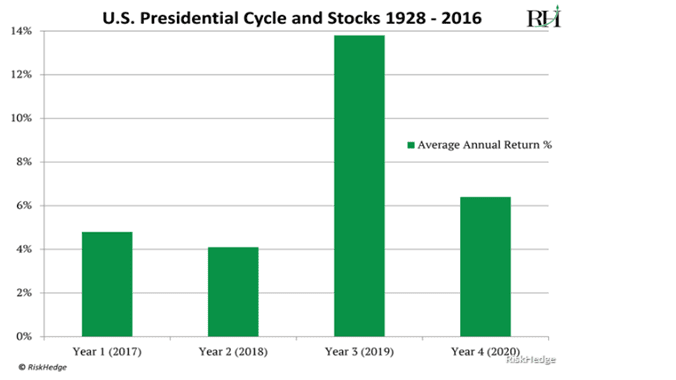
The second year of a presidential cycle is almost always the worst, and that is where we currently are. Now let’s examine one other very interesting fact. Since 1946, we have had 18 midterm elections, and in every instance, stocks were trading higher 12 months later. Think about that for a second that is a perfect score, and this has taken place under every political combination possible over the past 72 years. Stocks have risen an average of 17% in the year after midterms, and if one measures the gains from low to high, the results are even more impressive; stocks averaged 32% over the next 12 months. Therefore the 3rd year of the presidential cycle which we are very close to entering is the strongest year for stocks.
Behavioral Finance: Bonds Issuing Bullish Signal For Stocks
When bonds start to outperform stocks, it confirms that panic is setting in and as long as the trend is up, this has to be viewed as long-term bullish development. Note that the Fed decided not to raise rates in the last meeting and Powell is now hinting that headwinds in 2019 might mean that further rate hikes are no longer guaranteed. Most central bankers are taking a similar stance; a clear confirmation that this global recovery is illusory and heavily dependent on easy money.
The Fed should have taken a stronger stance back in 2008, but it did not and to do so now would create 5X more chaos than it would have back in 2008 and it is highly unlikely they would risk triggering a global recession as the entire world has gone on a debt binging spree
Using Behavioral Finance To Come Up With A Game Plan
Despite this strong rally the markets are still trading in the extremely oversold ranges on the daily charts; potentially the Dow could rally to the 25,600-25,700 ranges with a possible overshoot to 26,000 before pulling back. On the weekly charts as shown below the MACD ’s are trading in the overbought ranges, so the current rally is going to run into resistance sooner or later; indicating that this upward move is going to be volatile. Market Update Oct 31, 2018
While the current volatility is unsettling; the focus should be on the fact that we are very close to approaching ideal buying conditions. These types of setups do not occur often. The last setup occurred almost three years ago.
The trend is up, and we know that the ride has been volatile so far, but if the trend holds up (it is showing no signs of weakness yet), and our indicators on the monthly charts move to the extremely oversold ranges as they did in 2016, it could prove to be one helluva of an opportunity. To date, such a pattern has never failed to yield results when the trend is up. However, do not, we repeat, do not over-allocate funds to a single position, unless otherwise instructed.
Other Articles of Interest
Technology-Driven Deflation Will Kill The Inflation Monster (Feb 7)
Business Investment & Stock Market Uncertainty (Jan 31)
Dow 30 Stocks; what are they saying about the markets (Jan 30)
Stock Market Bull 2019; Follow The Trend & Avoid The Noise (Jan 29)
Long Term Trends & Bull Market Bear Market Nonsense (Jan 16)
Bull & Bear Market 2019: which one will prevail (Jan 14)
Stock Market Crash-Media Lies And Ignorant Experts (Jan 11)
Market Correction Vs A Back Breaking Market Correction (Jan 3)
