
Crude Oil Price Forecast: Illuminating the Future of Energy Markets
Updated June 2023
This article demonstrates that those who heed the lessons of history will consistently reap profits, while those who neglect these insights may find their finances depleted. The straightforward wisdom gleaned from our analysis of the 2016 oil market can serve as a valuable guide for navigating future crises, such as the COVID pandemic. This reflects the stance we firmly adopted back in 2016.
After trading as low as $27.56 oil reversed course and headed higher, it is now in a transition phase; moving from a down trending phase to a bottoming phase. Oil did not close below $30 on a monthly basis, so the outlook has not changed. The current bottom has all the signs of a fake bottom, meaning that it is probably a setup for the early bulls. Oil is likely to test its lows once again before a bottom takes hold. A bottom could take hold in the month of February. Oil, however, cannot close below $30 on a monthly basis, if it does, then the bottoming process could be delayed. Market Update Jan 31, 2016
As anticipated, oil recently reached new lows before stabilizing. It is crucial that oil does not conclude a monthly period below $30.00 to signal the establishment of a tradable bottom. In the forthcoming charts provided below, you will observe that the $30.00 mark holds significant importance, which is why it is imperative for oil not to breach this level on a monthly basis, as the previous support will transition into resistance.
Let’s examine oil across the following timeframes: five months, one year, and five years.
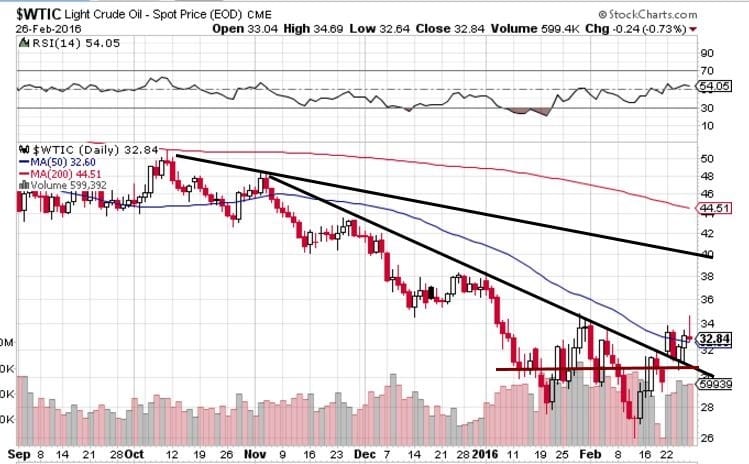
The five-month chart unmistakably highlights the significance of oil not ending a monthly period below $30.00. In the shorter timeframes, oil appears to be slightly overbought. Therefore, after a potential test of the $35.00 range, it could retrace and revisit its lows before resuming an upward trend. This sudden reversal serves as a maneuver to shake out early bulls and convince the bears that a market crash is imminent.
Crude Oil Price Forecast: one year chart
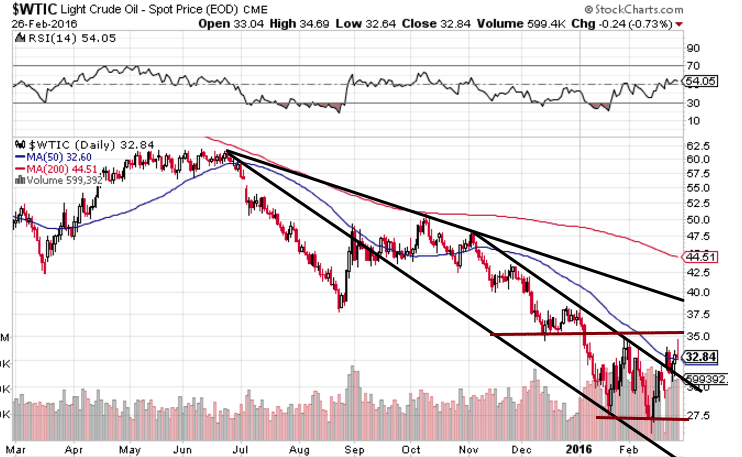
Key price points to focus on the one year chart. A weekly close above 35.00 will lead to a fast move to the 40.50-42.00 ranges, before pulling back.
Oil Prices five-year chart
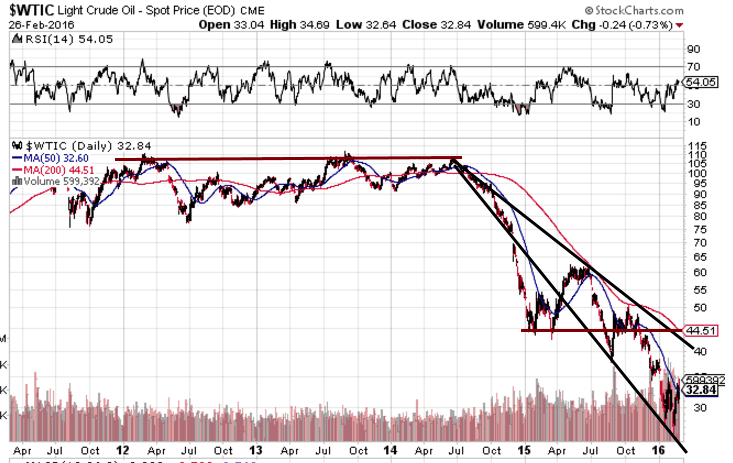
For oil to chart a positive course, it must maintain trading at or above its existing support and aim to challenge previous resistance levels. The fact that oil prices have dipped to new lows indicates a likelihood of retesting those lows in the future. However, the primary focus should not be on the possibility of oil reaching new lows, but rather on oil’s ability to avoid closing below the $30.00 mark on a monthly basis. As long as it can sustain itself above this crucial price threshold on a monthly basis, the outlook will lean towards a gradual ascent towards higher prices.
Key price levels for the 5-year chart
Oil must hold above $30.00 every month.
To indicate a move to move to the 50 plus ranges, oil would need to close above 45.00 on a weekly basis.
July 2017 update
oil traded within the suggested ranges as it managed to stay above $30.00 on a monthly basis. It is now consolidating and could drop as low as $30.00 before trending upwards again. After that oil, should slowly trend towar the $60.00 ranges and potentially as high as $90.00. We will examine this in more detail when oil closes above $60.00 on a monthly basis.
Originally published in February 28, 2016, this article has been periodically updated over the years, with the most recent update completed in June 2023.
Other articles of interest:
China targets corruption: strikes zombie companies hard (Feb 27)
Mob Mentality: Understand, Overcome and Win Stock-Market Game (Feb 26)
Interest rate wars-Fed stuck between a hard place & Grenade (Feb 23)
Crisis investing: stock market crashes represent opportunity & not disaster (Feb 23)
Central banks declare war on Citizens (Feb 23)
Crude oil bottomed in 2016; well it depends on these factors
