
Market Sentiment: Excessive Bullishness on the Rise
September has, in part, lived up to its name as being one of the worst months of the year. While September might be the worst month of the year, the most volatile month is October. This year, the volatility might extend to early November. Hence, traders should prepare themselves to deal with an extra dose of volatility. Still, after this phase, the markets are expected to mount a robust rally. Market Update September 30, 2021
This pattern of rising volatility will continue until the MACDs undergo a bullish crossover or the bullish sentiment drops below 20. One final option is for neutral sentiment to soar to the 48 to 51 ranges; the higher, the better. If one or more of these conditions are met, volatility levels should drop significantly and potentially trigger an explosive upward move.
The deeper the MACDs and the RSI move into the oversold zones, the better the opportunity. The markets are holding up remarkably well since both the MACDs and RSI are trending downwards. Once this corrective phase is over, the most likely follow-through outcome is a potent rally.
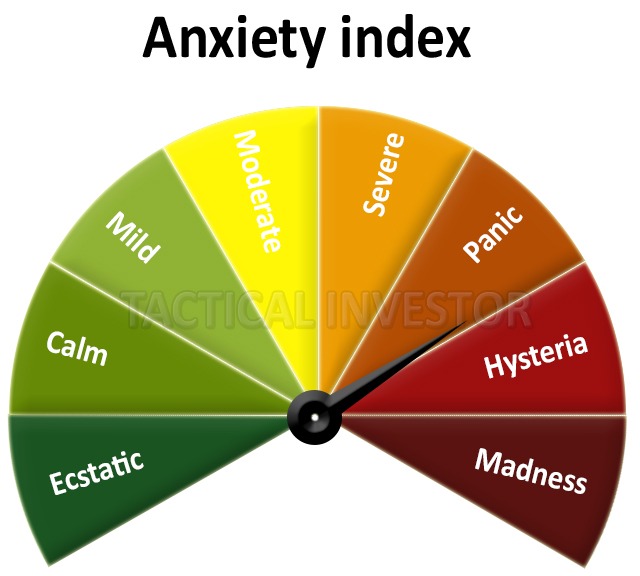
The Crowd is scared but not scared enough
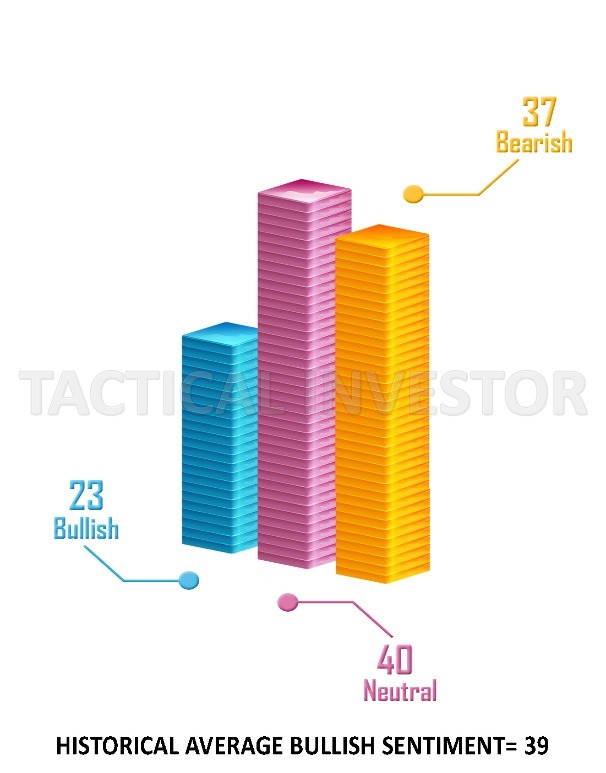
Bearish sentiment surged upwards, so the markets could/should rally for another 3 to 6 days. The clock started on Friday. Market Update September 30, 2021
The above outlook has come to pass. The Dow has tacked on roughly 1000 points since the last update was sent out. We are tabulating the current data, but it looks like bullish sentiment will come in below its historical average. This volatile action should remain in effect until the 21st of this month. Ideally, it continues until early November, when the masses will be driven insane with uncertainty. If Neutral sentiment soared to 48 or higher, we would take it as a clear signal that a bottom is in and that the old highs will be taken out.
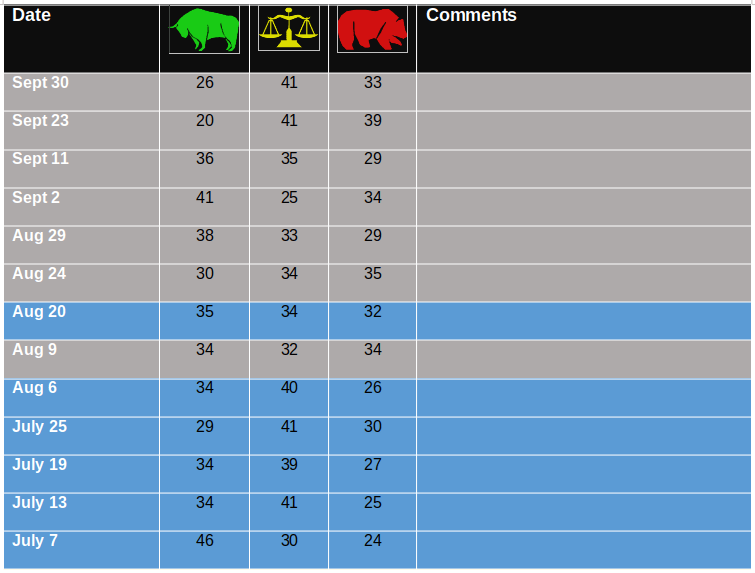
Historical Sentiment values
The silent correction theory continues to gain traction. Market Update September 30, 2021
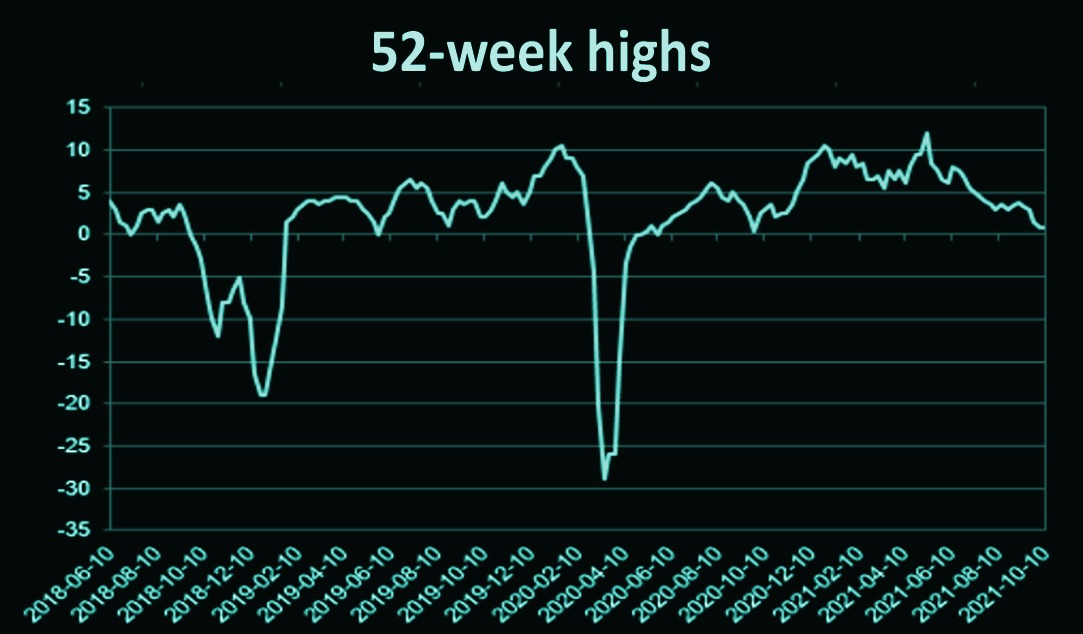
The silent correction hypothesis continues to hold true. The two charts below add more credibility to this hypothesis. Additionally, as we stated previously, many tech stocks took it to the chin. They shed in some cases, more than 30% from high to low. We also noted that many of these stocks would recover from those losses twice as fast. Look at the stunning recovery many Tech Stocks have mounted over the past few weeks.
The experts were almost sure the markets would crash in September, but they were all barked with no bite as usual. The current pullback at its worst point in September cannot even be classified as a minor correction. At best, it was nothing but a hiccup.
The Dow would have to shed at least 7% before one could hope to label the pullback as a minor correction. However, many stocks sometimes experienced brutal corrections shedding over 30%. Two things stand out here. The markets traded lower in Sept, but the McClellan Index put in a higher low. Secondly, we have a positive divergence signal.
Conclusion
When uncertainty rules the roost, market volatility is a traders/investors best friend. The trend is your friend; everything else is your foe. Market Update September 30, 2021
The current pullback is a non-event. We would not blink until the Dow shed at least 4500 points. Until then, everything that occurs should be classified as a hiccup or a non-event. However, many stocks had shed enormous weight, which seems to validate the silent correction theory we put forward before the markets started to pull back.
Our anxiety index has moved deeper into the panic zone. Bullish sentiment readings are well below their historical average. The experts all claim that a brutal correction is around the corner. The likely outcome is that the markets continue trending sideways to confound the bulls and the bears further. In this day and age, sideways action entails a lot of volatility. The markets could trade between a narrow range but experience rapid moves of 250 to 600 points in both directions within a 24-to-48-hour period. Such action would drive most individuals insane, and the uncertainty levels would soar. This is the most favoured outcome as its effects are long-lasting. By the time the crowd snaps out of its stupor, the markets will be trading close to new highs. Higher Neutral sentiment readings equate to a rise in uncertainty.
Other Articles of Interest

The Audacious Rise: How much has the stock market gone up in 2016

Palladium History: Pursuing Profitable Trends

From Zero to Stock Market Hero: Stock Investing for Dummies PDF

Percentage of Americans That Own Stock: Unlocking the Data

Real Estate Investing for Dummies: The Straightforward Path to Building Wealth

Tantalizing Uranium Stocks Soaring: A Contrarian Perspective

Refinement and Riches: Uncover the Luxurious World of Financial Freedom Books

Wisdom in Reverse: Learning the Hard Way How to Lose Money in Stocks

Clear-Cut Investing: Distinguishing Fundamental Analysis from Technical Analysis

Market Psychology Chart: Tips for Informed Investment Decisions

Selling Covered Calls For Income: Elevate Your Income Strategy

Contrarianism: Capitalizing on Dissent in the Market Maze

Amazon Stock Direct Purchase Plan: A Comprehensive Guide

Copper ETF: The Great Investment Debate – Buy-In or Miss Out?