
Market Psychology Chart: What is it and How Does it Work?
March 31, 2024
The stock market is a dynamic entity influenced by various factors ranging from macroeconomic trends to company-specific news. Amidst this complexity, investors often grapple with understanding the market’s behaviour and predicting its next moves. This is where the market psychology chart comes into play.
A market psychology chart is a tool that tracks investor sentiment, providing valuable insights into market trends. It visually represents the collective emotional states of investors at different stages of a market cycle. The horizontal axis typically represents the market valuation relative to its fundamental value, ranging from oversold to overbought extremes. The vertical axis charts the prevailing emotional state, from fear and despair at one end to hope and greed at the other.
As the market ebbs and flows, so do the investors’ emotions. During periods of optimism and rising prices, emotions like denial, hope, and euphoria dominate. Conversely, anxiety, fear, and panic take hold when the market is in a downturn.
These emotional stages provide contrarian signals. Savvy investors leverage these signals to time their entries and exit counter to the crowd. For instance, when despair takes over after panicked selloffs, it often lays the groundwork for a new bull market. This is when behaviourists aim to buy more rationally when others capitulate irrationally.
The market psychology chart also acknowledges cognitive biases like overconfidence or loss aversion that can distort mass views during critical phases. Identifying divergences between emotional indicators and fundamentals can help foresee trend changes.
While it’s an inexact social science, plotting emotional patterns revealed within market fluctuations offers a contrarian lens for mitigating behavioural pitfalls through different cycles. Pairing sentiment readings with other analytical tools empowers investors to navigate the turbulent seas of mass opinion.
The Psychology Of Market Cycle
The psychology of a market cycle plays a crucial role in investor decision-making, as emotions often guide buying and selling behaviour. Understanding the emotional aspects of each stage of the market cycle can help investors recognize patterns and anticipate market trends. The four stages of the market cycle – accumulation, markup, distribution, and markdown – are characterized by distinct emotions that drive investment trends.
Herman Hesse, a renowned German-Swiss poet and novelist, once said, “Every age, every culture, every custom and tradition has its character, its weakness and its strength, its beauties and cruelties.” This quote can be applied to the market cycle, as each stage has unique characteristics and emotional influences.
During the accumulation stage, investors who have done their due diligence and identified undervalued assets begin to buy. This phase is often marked by caution and scepticism as investors carefully enter the market, seeking opportunities others may have missed. As the market transitions into the markup stage, optimism and excitement take hold, and prices rise. Investors who missed the initial opportunity may experience FOMO (fear of missing out), and this stage is often associated with euphoria as investors see their investments proliferate.
Peter Lynch, a successful investor and mutual fund manager, emphasized the importance of research and staying informed. He stated, “The key to making money in stocks is not to get scared out of them.” This advice is particularly relevant during the distribution stage, when early investors may start taking profits, leading to increased selling pressure. Greed can still exist as investors try to maximize their gains, but caution and scepticism resurface as the market peaks.
Finally, the markdown stage arrives, bringing with it fear and panic. Prices begin to fall, and late entrants to the market may experience regret and anxiety. This stage can be emotionally challenging as investors face the fear of losing their investments and uncertainty about when the market will stabilize. Lynch also noted, “The real key to making money in stocks is not getting scared out of them.” This highlights the importance of maintaining a long-term perspective and avoiding impulsive decisions based on short-term emotions.
By recognizing the emotions that drive each stage of the market cycle, investors can make more informed decisions. Maintaining a level-headed approach and avoiding making impulsive choices based solely on emotions is essential. Investors can confidently navigate the market cycle by keeping a long-term perspective and conducting thorough research. Understanding and interpreting these phases can give investors a comprehensive market view and help them make better investment decisions.
Understanding the Market Psychology Chart
A market psychology chart is a tool that captures the emotions of investors and traders, both rational and emotional, that influence market behaviour. These emotions include fear, greed, optimism, and pessimism. By analysing these sentiments, the chart can help identify market trends and turning points, providing valuable signals for investors.
The chart plots the market valuation relative to its fundamental value on the horizontal axis, ranging from oversold to overbought extremes. The vertical axis charts the prevailing emotional state, from fear and despair at one end to hope and greed at the other.
As the market moves, so do the emotions of the investors, during periods of optimism and rising prices, emotions like denial, hope, and euphoria dominate. Conversely, anxiety, fear, and panic take hold when the market is in a downturn.
These emotional stages provide contrarian signals. Savvy investors leverage these signals to time their entries and exit counter to the crowd. For instance, when despair takes over after panicked selloffs, it often lays the groundwork for a new bull market. This is when behaviourists aim to buy more rationally when others capitulate irrationally.
The market psychology chart also acknowledges cognitive biases like overconfidence or loss aversion that can distort mass views during critical phases. Identifying divergences between emotional indicators and fundamentals can help foresee trend changes.
While it’s an inexact social science, plotting emotional patterns revealed within market fluctuations offers a contrarian lens for mitigating behavioural pitfalls through different cycles. Pairing sentiment readings with other analytical tools empowers investors to navigate the turbulent seas of mass opinion.
In conclusion, the market psychology chart is valuable for any investor. By understanding the emotional undercurrents that drive market movements, investors can make more informed decisions, enhancing their investments’ performance.
What are the benefits of using a Market Psychology chart
Market psychology charts, which focus on market sentiment, offer several key advantages for investors:
1. Objective Decision-Making: Investors can remain focused and avoid panic during downturns or excessive enthusiasm in market rallies by analysing sentiment evolution.
2. Early Trend Detection: Emotional extremes on the chart often signal market tops and bottoms before prices reverse, indicating potential trend changes early.
3. Avoiding Euphoria: The chart helps identify when buying interest shifts from fear to greed, preventing traders from entering costly, late-stage positions.
4. Mitigating Behavioral Biases: Visualizing biases, like overconfidence, encourages rational decision-making aligned with fundamental analysis.
5. Promoting Contrarian Thinking: Recognizing overly optimistic or pessimistic views inspires contrarian trades, offering superior risk adjustment compared to following the crowd.
As Warren Buffett once said, “Be fearful when others are greedy and greedy when others are fearful.” Market psychology charts can help investors identify these sentiment extremes and make more informed decisions.
Another renowned investor, John Templeton, emphasized the importance of contrarian thinking: “Bull markets are born on pessimism, grow on skepticism, mature on optimism, and die on euphoria.” Investors can better navigate market cycles by using market psychology charts to recognize these stages.
While market psychology charts provide valuable insights, they should be used with other technical and fundamental analysis tools. As with any investment strategy, discipline and risk management are crucial for long-term success.
Understanding Market Psychology and Interpreting the Market Psychology Chart
Market psychology refers to the prevailing sentiment of investors at any given time and can impact market direction regardless of fundamentals. The market psychology chart is a tool that helps traders understand the emotions driving market movements, typically including metrics such as sentiment surveys, trading volumes, and volatility indices.
Interpreting the market psychology chart involves understanding the collective sentiment of investors and how it influences market trends. Key factors to consider include:
– Looking for trends and patterns that emerge, indicating whether investors are becoming more bullish or bearish
– Analyzing multiple metrics in combination to get a comprehensive picture of market behaviour
– Considering the broader market context, such as significant economic or geopolitical events influencing investor sentiment
– Being aware of biases and herd behaviour among investors, as cognitive and emotional biases greatly influence market psychology
As Herman Hesse once said, “Every age, every culture, every custom and tradition has its own character, its own weakness and its own strength, its beauties and cruelties.” This quote applies to the market cycle, as each stage has unique characteristics and emotional influences.
Peter Lynch emphasized the importance of managing emotions when trading: “Your biggest enemy, when trading, is within yourself. Success will only come when you learn to control your emotions.” Adverse effects of trading psychology generally have a more significant impact on investment decisions than positive psychology.
By understanding market psychology and interpreting the market psychology chart, traders can make more informed decisions and better navigate the market. However, it is crucial to manage one’s own emotions and avoid impulsive, emotion-driven decisions to achieve long-term success in trading.
Using the Market Psychology Chart for Timing the Market
While timing the market is notoriously difficult, the market psychology chart can provide valuable signals for investors looking to buy or sell at opportune times. Here are some strategies for using the chart for market timing:
– Identify turning points where investor sentiment changes direction, which can indicate a change in the market trend and an opportunity to enter or exit the market.
– Watch for divergences between investor sentiment and market prices, which can signal a potential market reversal.
– Use multiple indicators, such as technical analysis indicators, in combination with the market psychology chart to provide more comprehensive signals for market timing.
However, it is essential to remember that market timing is not an exact science and involves risk. As Peter Lynch, a renowned investor, once said, “Far more money has been lost by investors preparing for corrections, or trying to anticipate corrections than has been lost in corrections themselves.” Lynch emphasizes the importance of a long-term investment strategy rather than attempting to time the market.
Warren Buffett, another legendary investor, advises against market timing, stating, “The only value of stock forecasters is to make fortune-tellers look good.” Buffett believes that investors should focus on the long-term potential of their investments rather than trying to predict short-term market movements.
While the market psychology chart can provide valuable insights into investor sentiment and potential market trends, it should be used with other indicators and within the context of a broader investment strategy. As Lynch and Buffett suggest, a long-term, disciplined approach to investing is more likely to yield success than attempting to time the market based on short-term fluctuations in investor sentiment.
Sources for Stock Market Psychology Charts
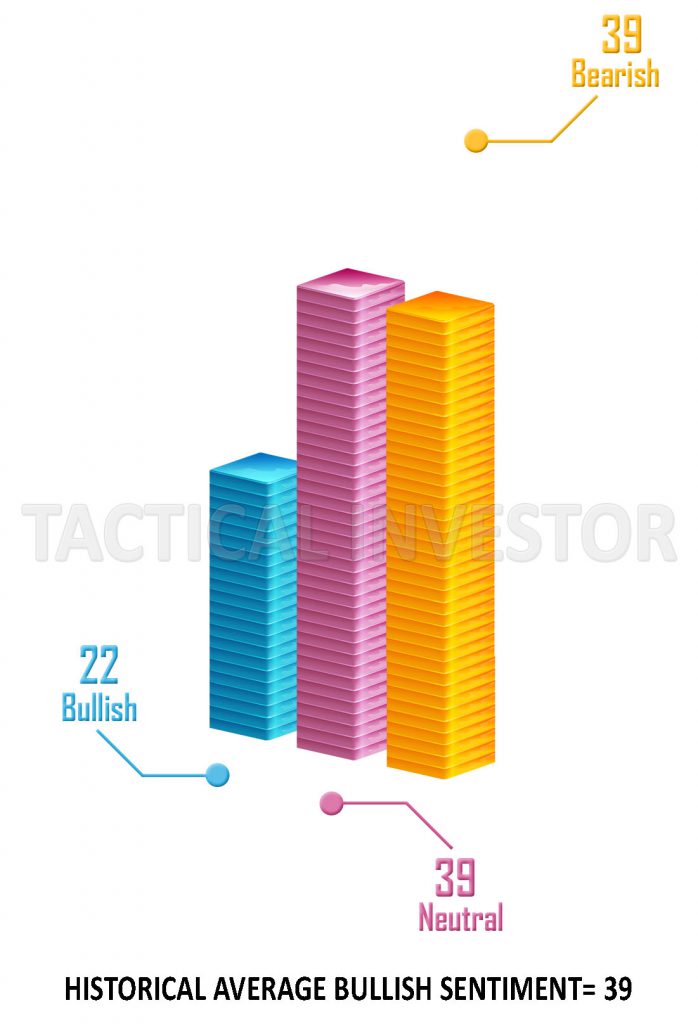
If you’re looking for charts of this kind, you’ve come to the perfect place. By joining our free subscription, you can access our frequent updates. These charts have definite advantages, especially at emotion peaks. For instance, a market top will occur if bullish sentiment stays above 60 for an extended time. Similarly, a market bottom is probably imminent when the pessimistic view is close to 60.
The most exciting development will occur when neutral sentiment surpasses 55, though. This pattern shows that the bull market will continue considerably and that the long-term market bottom is near. This is because cautious investors frequently take their time to accept a new bull market. When investor irritation is this intense and might linger for years, neutral sentiment is at an all-time high.
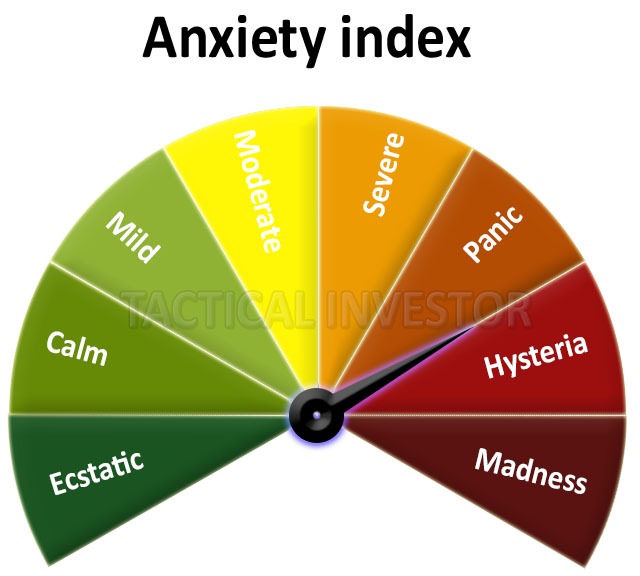
Our customised anxiety index moves to severe levels when a bullish or bearish trend is about to begin. Fusing this data with technical analysis and mass psychology can produce powerful outcomes.
Conclusion
The market psychology chart can be a valuable tool for investors looking to understand investor sentiment better and make informed investment decisions. Using the chart to supplement fundamental and technical analysis, investors can identify turning points and extremes in investor sentiment and use this information to improve their investment outcomes. However, it’s essential to be aware of biases and not rely too heavily on the chart for investment decisions. By taking a holistic approach to investing and using multiple indicators, investors can improve their chances of success in the market.
So, the next time you analyse the market, include the market psychology chart in your toolkit. It may provide the insight you need to make the right investment decisions.
Remember the tips and strategies we discussed in this article, and be patient and remain disciplined in your investment approach.
Suppose you want to discover more about the market psychology chart and how to utilise it to improve the performance of your investments. Do your research and chat with a financial professional.
Beyond the Ordinary: Fascinating Articles That Stand Out

Is now the time to buy stocks: Buy if the trend is up

Why Is Critical Thinking Important

Volatility of the stock market

Russian Economy improving; Inflation down over 50%

Interpreting the Implications of the Silver to Gold Ratio for Investors

Turbo-charge Your Returns: options investing for beginners

Mastering CHKP Stock Price Trends: Timing Pullbacks Strategically

The American Dream: Unveiling the American Nightmare

Short-Term vs Long-Term Investing Strategies

Investing for Success: A Wealth Management Guide

Michel de Montaigne: the man that was way ahead of his time

Smart Grid Investment Funds: A Gateway to the Future of Energy

Understanding Investor Behaviour

Strategies for Overcoming Stock Market Woes