
US leading indicators: Economic Recovery Is Illusory
Updated March 2023
A hallucination is a fact, not an error; what is erroneous is a judgment based upon it.
Bertrand Russell
Updated views are posted towards the end of the article
Despite the ongoing efforts of the financial media to prove that this economic recovery is real, it is essential to keep in mind that the Fed’s massive injection of money into the market and the low-interest-rate environment have been the primary driving factors behind the so-called economic recovery.
The Truth Behind Statistics
While many statistics may paint a rosy picture, the reality is that two key leading economic indicators have failed to confirm this recovery from the onset. The Baltic Dry index, which is one of the top US leading Indicators is trading well below its all-time high, indicating that there is no global economic recovery, and hot money is creating the illusion of one.
Why Selling Before a Market Crash is Necessary
It may be challenging to sell before the market crashes, but it is necessary to have discipline and a long-term perspective to do so. This requires sacrificing short-term gains for long-term growth, including holding cash when the market is overvalued and not buying into the hype of a bull market.
The Illusion of Recovery
The reality is that this bull market will only end when the masses embrace it like a “lost love.” Until then, all market corrections, from mild to wild, should be embraced as they are just temporary blips in the grand scheme of things. The excess cash in the system is creating the illusion of recovery, and removing it will lead to the collapse of the economy and the stock market.
US Leading Indicators: The Power of Contrarian Trading Strategies
Before continuing, let’s look at what we said in 2020 and how most of it came to pass.
In these turbulent times, taking a contrarian approach to the markets is essential. During the US leading indicators, such as the Baltic Dry Index, state that the economy is in trouble, savvy investors know that panic-selling is not the way to go.
The Art of Contrarian Trading
Contrarian trading involves buying stocks when they are undervalued and selling them when they are overvalued. This requires discipline and a long-term perspective. It means being willing to sacrifice short-term gains for long-term growth. It also means being willing to hold cash when the market is overvalued and not buying into the hype of a bull market.
To be a successful contrarian trader, it is essential to do your own research and not rely solely on the opinions of so-called experts. History has shown that these experts are often wrong and that the best way to make money in the markets is to think for yourself.
Trading in the Time of Coronavirus
The hysteria over the coronavirus is a prime example of how fear can distort the markets. While it is important to take precautions and protect oneself from the virus, it is also important not to let fear drive investment decisions.
The data on the coronavirus indicates that the high mortality rate is only applicable to older individuals and those with existing conditions. This means that the impact on the economy is likely to be short-term and that the markets will eventually recover.
The Case for a Short-Term Put Play
Given the intensity of the current sell-off, the markets are likely to mount a rally in the short term. However, history has shown that the first attempt at a rally usually fails and that preparing for another downward wave is essential.
One potential strategy for contrarian traders is to issue a short-term put play or open up a strangle position. This involves opening up both a call and put with different strike prices, allowing for a potential profit regardless of the market’s direction.
In conclusion, the current market conditions require a contrarian approach. By doing your own research, keeping a trading journal, and not letting fear drive investment decisions, savvy investors can take advantage of the opportunities presented by the current market turbulence.
Baltic Dry Index Signals Trouble for US Leading Indicators
Once considered a US leading indicator, the Baltic Dry Index has lost its reliability in recent years. The index measures the cost of shipping bulk goods such as coal, iron ore, and grain across the world’s oceans. It peaked in April 2008, just before the global financial crisis, and has been putting in lower highs ever since.
The Rise and Fall of the Baltic Dry Index
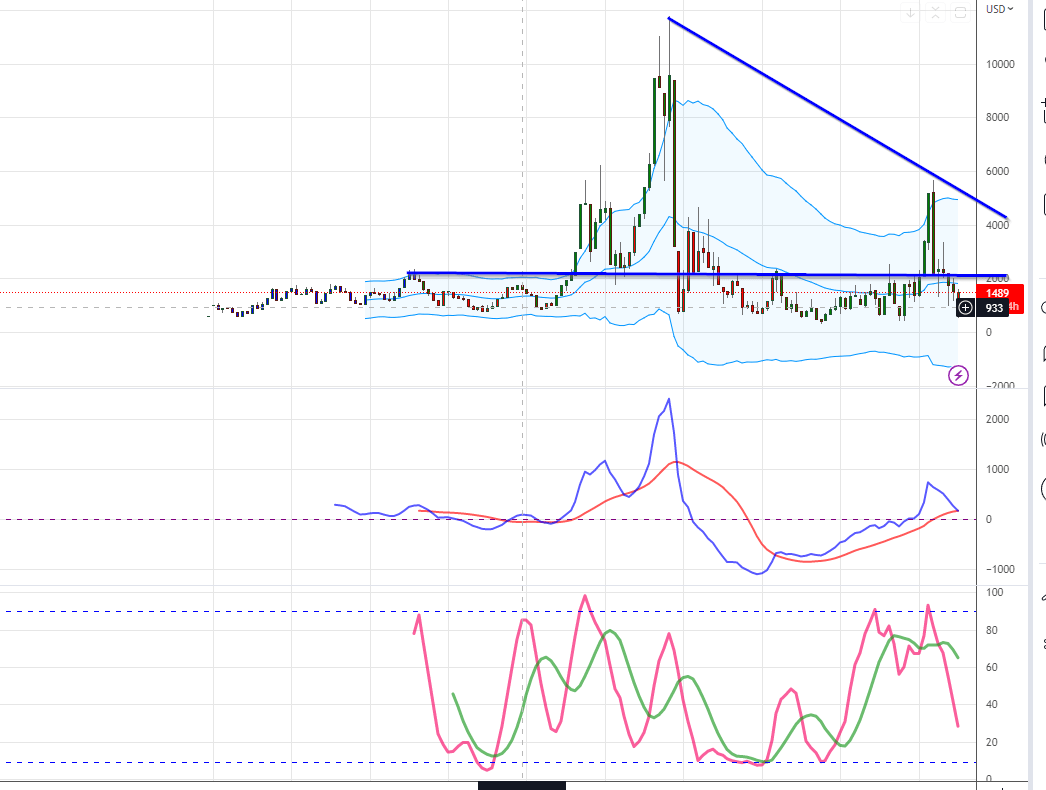
At its peak in 2008, the Baltic Dry Index was at 11,793 points. By December of that year, it had fallen to just 663 points. The index rebounded in the years that followed but has remained well below its 2008 peak. As of March 2023, it stands below 1000
How the Playing Field Has Been Altered
The Baltic Dry Index is no longer a reliable economic indicator because the playing field has been altered. The index was once driven by supply and demand for raw materials such as coal and iron ore. Today, it is more influenced by hot money and a low-interest-rate environment. The massive injections of liquidity by central banks around the world have created an imaginary economy that is propped up by easy money.
The Illusory Recovery

The Baltic Dry Index can still be used to indicate global trade volumes, but it can no longer be relied upon to predict the economy’s strength or the stock market’s direction. The current recovery is not based on real economic growth but on a massive influx of hot money into the system. As long as the central banks keep interest rates low and continue to pump liquidity into the system, the economy and the stock market will continue to show signs of life. But this recovery is an illusion that will eventually come crashing down.
The Danger of Relying on US Leading Indicators
The decline in the Baltic Dry Index’s reliability is a cautionary tale about the perils of relying on a single economic indicator, particularly among the array of US economic leading indicators. The index was once considered a leading indicator of economic activity, but it can no longer be trusted to provide accurate information about the state of the global economy. Investors and policymakers need to look at various indicators and data points to understand the economic landscape. They risk making decisions based on incomplete or inaccurate information by relying on a single indicator.
US Leading Indicators Source: Data Is contaminated?
If you believe the data the BLS (Bureau of labour statistics) issues, the outlook is quite rosy. However, these chaps purposely omit individuals who have given up looking for a job and paint a false picture of what is happening. According to shadow Stats, the unemployment rate as of May 2017 was 22%, which starkly contrasts the Bureau of labour statistics’ 4.8% rate.

The US Bureau of Labor Statistics (BLS) reports the official unemployment rate in the United States. However, some analysts argue that the BLS’s methods for calculating unemployment are inaccurate and can be misleading. According to ShadowStats, an alternative economic data firm, the actual unemployment rate in the US is closer to 23% rather than the official rate of around 4%.
US Leading Indicators: The Labor Force Participation Rate
One of the key issues with the BLS’s unemployment calculation is how it defines the labour force. The BLS defines the labour force as the total number of employed individuals plus those who are unemployed but actively seeking work. However, individuals who have stopped looking for work are not included in the labour force, which can skew the unemployment rate.
The labour force participation rate is the percentage of the population that is either employed or actively seeking employment. The US’s current labour force participation rate is around 61%, which is historically low. This means that a significant portion of the population is not included in the labour force, and therefore not counted as unemployed by the BLS.
Discouraged Workers
Another issue with the BLS’s unemployment calculation is how it treats “discouraged workers.” Discouraged workers have stopped looking for work because they believe there are no jobs available for them. The BLS does not count these individuals as unemployed because they are not actively seeking work. However, this can be misleading because these individuals are not employed and are therefore not contributing to the economy.
Underemployment
The BLS’s calculation of unemployment also fails to account for underemployment. Underemployment refers to employed individuals working part-time or in jobs that do not fully utilize their skills and education. These individuals may not be considered unemployed by the BLS, but they are not working at their full potential and may be struggling financially as a result.
While the BLS’s unemployment calculation is widely accepted as the official measure, it has limitations. The labour force participation rate, discouraged workers, and underemployment are all factors that can impact the accuracy of the official unemployment rate. Some analysts argue that the BLS’s methods for calculating unemployment are accounting gimmicks designed to make the unemployment rate appear lower than it is. ShadowStats’ estimate of 23% unemployment in the US suggests that there may be more to the story than what the official numbers indicate.
US Leading Indicators: Is a Crash or Correction Looming?
The Baltic Dry Index, once hailed as one of the US economic leading indicators, has lost its reliability in recent years, as it is trading 90% below its all-time high. Copper is also trading at a price slightly above its multi-year lows, casting a shadow on the idea of a robust economic recovery. In addition, real unemployment, when taking into account those who have stopped looking for a job, stands at over 20%, making the current economic data appear to be a manufactured illusion.
Manufactured Data from the BLS
The Bureau of Labor Statistics (BLS) issues data that purposely omits a large section of the population, painting a false picture of economic prosperity. The omission of individuals who have stopped looking for a job is a prime example. They stop looking for work because they have been rejected many times, leading them to believe they are worthless. There are stories of people submitting hundreds of resumes without receiving even one response.
The Fed’s Power Over the Market
Despite evidence indicating the illusory nature of the economic recovery, the stock market continues to trend higher. This trend illustrates the Federal Reserve’s power over the economy and the markets. However, the first signs of an impending epic meltdown are emerging in the precious metals and commodities markets. Experts have been predicting a market correction or crash from the onset, and it seems that we are now at the cusp of this historic event.
The System Will Collapse, but Nobody Knows When
The system will only collapse when the masses lose faith in Fiat. However, given the current trend, the masses are not even close to this stage. An educated guess would suggest that when the global debt approaches $1000 trillion, the masses might be ready to challenge the system. Until then, market crashes should be viewed as long-term buying opportunities.
Crash or Correction?
While the stock market may continue to trend higher for a bit longer, the first subtle signs of a possible market correction or crash are emerging. This does not mean that the stock market will crash tomorrow, but it is essential to be aware of these signs and prepare accordingly. As we have seen before, a market crash should be viewed as a long-term buying opportunity. Therefore, investors should keep a level head and focus on long-term growth instead of panicking.
US Leading Indicators: Article Overview
In summary, the US economic recovery is illusory and is being propped up by the Federal Reserve’s massive injection of money into the market and low-interest rates. The reliability of US leading indicators such as the Baltic Dry Index has also been called into question, making it necessary to take a contrarian approach to the markets.
Contrarian trading involves buying stocks when they are undervalued and selling them when they are overvalued, and it requires discipline and a long-term perspective. Additionally, using mass psychology and contrarian investing can help deal with the wrong data coming from US leading economic indicators such as the Baltic Dry index and unemployment rate.
Contrarian Trading in the Face of Uncertain Economic Indicators
The decline in the reliability of the Baltic Dry index is due to the playing field being altered, with hot money and a low-interest-rate environment having more influence than supply and demand for raw materials. The illusory recovery will eventually come crashing down, and relying on a single economic indicator can lead to incomplete or inaccurate information.
The Bureau of Labor Statistics calculation of unemployment has limitations, and the real unemployment rate is higher than what is reported due to the omission of individuals who have stopped looking for a job.
Although the stock market may continue to trend higher for a bit longer, the first subtle signs of a possible market correction or crash are emerging.
This should be viewed as a long-term buying opportunity, and investors should focus on long-term growth rather than short-term gains. The system will collapse when the masses lose faith in Fiat, but this is not likely to happen anytime soon. Therefore, market crashes should be viewed as long-term buying opportunities.
A dreamer is one who can only find his way by moonlight, and his punishment is that he sees the dawn before the rest of the world. Oscar Wilde
Articles That Inspire: Our Collection of Compelling Reads

IBM Stock Price Prediction: Time to Buy or Fly?

Investor Sentiment Index Data: Your Path to Market Success

Unraveling Market Psychology: Impact on Trading Decisions

Is Value Investing Dead? Shifting Perspectives for Profit

What Will Happen When the Stock Market Crashes: Time to Buy

Dogs of the Dow 2024: Barking or Ready to Bite?

The Trap: Why Is Investing in Single Stocks a Bad Idea?

How Can Stress Kill You? Unraveling the Fatal Impact

Clash of Titans: Unleashing Inductive vs Deductive Reasoning

Financial Mastery: Time in the Market Trumps Timing

Investment Pyramid: A Paradigm of Value or Risky Hail Mary?

Contrarian Investing: The Art of Defying the Masses

Quantitative Easing: Igniting the Corruption of Corporate America

Uranium Market Outlook: Prospects for a Luminous Growth Trajectory