 Esoteric Mastery: Unveiling Trading Cycles for Profitable Market Moves.
 Esoteric Mastery: Unveiling Trading Cycles for Profitable Market Moves.
Updated Feb 27, 2024
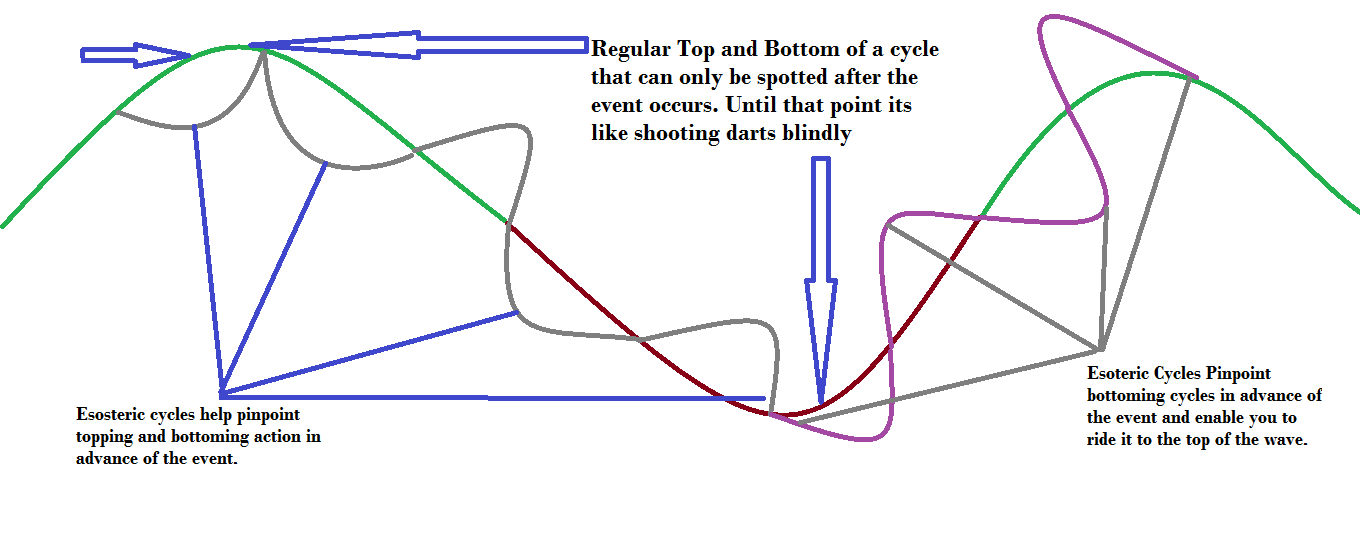
We have tested the validity of Esoteric Cycles with 50 years of data on the leading indices. We have never seen this indicator fail to warn of topping and bottoming action. It does not predict exact tops or bottoms as that is Fool’s endeavour. Once you identify market turning points, you can position yourself for the next move. Sometimes, you might get in a bit early, but as the saying goes, the early bird gets the worm, the late the bullet.
Esoteric Cycles works incredibly well with our top stand-alone indicator, the trend indicator. As stated, our objective is not to look for the exact top or bottom but to get in or out when the market is either Bottoming or Topping. Trying to locate the top or bottom is best left to people who thrive on failure and have plenty of time.
Unveiling Esoteric Secrets: Beyond the Surface of Market Perception.
Explore the Enigma: This book provides a glimpse into the complex mechanisms of mysterious cycles, providing unique insight into their dynamic nature.
Contrary to what many believe, cycles go beyond the common notion of markets swinging between overbought and oversold conditions. If we dig deeper, we find a mix of waves and smaller cycles intricately woven into the bigger picture. This complexity explains why oversold markets can continue downward until the minor cycle aligns with the primary trend. Similarly, overbought markets can keep soaring, seemingly defying logic, until the hidden cycles run their course.
These cycles appear mysterious because people often oversimplify the widely held belief that markets only move between overbought and oversold states. While this is happening, other cycles are at play, shaping the market’s trajectory. So, it’s not just about the straightforward movement from one extreme to another; there’s more complexity beneath the surface.
Transforming Technical Analysis into Artistry
To benefit from esoteric cycle analysis, one needs to visualize the cycle, and then one needs to determine if the Esoteric Cycles are oscillating up or down. If they are oscillating down, then the money is made by spotting a sell signal and shorting the markets; a sell signal is usually issued around the peak of the cycle. A sell signal does not mean the calls will nosedive; you will still get up and down movements; nothing drops in one shot. Markets move up and down in waves.
If you can master Hurst’s cycles, you will come one step closer to understanding esoteric processes. If you did not understand a word I said above, don’t worry about it.
Think of trading cycles in terms of a picture. If you can spot the pattern in the image (all images have a pattern), it’s infinitely easier to identify the market trend. Once you know the trend, the rest is as easy as taking candy from a baby.
Consider the insights below for novices, extending the exploration of esoteric cycles and deepening the understanding initiated above.
Esoteric Cycles & Hidden Pivot Points in Technical Analysis
The Art of Technical Analysis
Technical analysis is an art, a dance of numbers and charts that can reveal the hidden rhythms of the market. One of the most intriguing aspects of this art is the study of esoteric cycles. These cycles, validated with 50 years of data on leading indices, offer a unique perspective on market trends.
Technical analysis is not just about crunching numbers or following algorithms. It’s about understanding the underlying forces that drive market movements. It’s about interpreting the market is story through its price and volume data. This requires analytical skills, creativity, intuition, and a deep understanding of market psychology.
Esoteric cycles are a vital part of this story. These cycles represent the recurring patterns of market behaviour that can often be traced back to the collective psychology of market participants. They reflect the ebb and flow of optimism and pessimism, the shifting balance of supply and demand, and the cyclical nature of economic and business cycles.
Understanding these cycles can provide valuable insights into market trends. For instance, a process might reveal that the market tends to rise in the spring and fall in the autumn or that a particular stock performs well during economic expansions and poorly during recessions. These insights can help traders identify potential trading opportunities and make more informed investment decisions.
However, interpreting esoteric cycles is not a straightforward task. These cycles are often hidden beneath the market’s surface, obscured by the noise of daily price fluctuations. Uncovering these cycles requires a keen eye, a patient mind, and a willingness to delve deep into the market’s complexities.
In essence, the art of technical analysis is about finding order in the chaos of the market. It’s about uncovering the hidden patterns that govern market movements and using this knowledge to navigate the market’s twists and turns. In this endeavour, esoteric cycles serve as a powerful tool, a compass guiding traders through the often turbulent seas of the market.
Understanding Esoteric Cycles
Esoteric cycles, a fascinating aspect of technical analysis, do not aim to predict exact market tops or bottoms – an endeavour often deemed foolhardy. Instead, they serve as an early warning system for market turning points, enabling traders to position themselves strategically for the next market move. In the trading world, the early bird gets the worm and sidesteps the bullet of a sudden market downturn.
These cycles, often seen as the market’s hidden rhythm, reflect the collective psychology of market participants. They represent the ebb and flow of optimism and pessimism, fear and greed, and buying and selling pressures. Understanding these cycles requires keen observation and a deep understanding of market dynamics.
Esoteric cycles are not standalone but are most effective with other technical analysis tools. They can help identify potential entry and exit points. Still, they should be used alongside trend analysis, momentum indicators, and other technical analysis tools to confirm signals and reduce the risk of false signals.
Moreover, esoteric cycles are not static but dynamic. They evolve with the market, reflecting changes in market sentiment, economic conditions, and other factors. This dynamism makes understanding esoteric cycles both challenging and rewarding.
Esoteric Cycles: The Rhythmic Dance of the Market
Esoteric cycles are not static; they move up and down in a rhythmic dance. This dance reflects the market’s heartbeat, the ebb and flow of buying and selling pressures, and the shifting sentiments of market participants. When the cycles oscillate down, the savvy trader looks for a sell signal, usually issued around the peak of the process. This doesn’t mean a nosedive is imminent—markets move in waves, not straight lines. But it does suggest that a downturn may be on the horizon.
This oscillation of esoteric cycles is a testament to the dynamic nature of the market. The market is not a machine that operates in a predictable, linear fashion. It’s a complex, adaptive system constantly evolving and constantly in flux. Just as a dancer must adapt to the changing rhythm of the music, so must a trader adjust to the changing rhythm of the market.
Reading and interpreting these cycles is a valuable skill in trading. It allows traders to anticipate market movements to position themselves ahead of significant market shifts. But it’s not just about predicting the market’s next move. It’s about understanding the market’s underlying dynamics and the forces that drive its movements.
However, interpreting esoteric cycles is not a straightforward task. These cycles are often hidden beneath the market’s surface, obscured by the noise of daily price fluctuations. Uncovering these cycles requires a keen eye, a patient mind, and a willingness to delve deep into the market’s complexities.
The Power of Visualization
To truly harness the power of esoteric cycles, one must learn to visualize them. Imagine a picture, a pattern emerging from the chaos. Once you can see this pattern, you can identify the market trend. And once you know the trend, trading becomes as easy as taking candy from a baby.
Visualization is a powerful tool in technical analysis. It allows traders to see beyond the raw numbers and charts to perceive the underlying patterns that govern market movements. These patterns are often hidden beneath the surface, obscured by the noise of daily price fluctuations. But with practice and patience, traders can learn to see these patterns and read the market’s hidden language.
Visualizing esoteric cycles is like looking at a complex piece of art. At first glance, the image may seem chaotic, even random. But a pattern emerges as you look closer and allow your eyes to adjust. This pattern is the key to understanding the artwork and unlocking its hidden meaning.
The same is true for esoteric cycles. These cycles may seem complex and confusing initially, but they make sense as you learn to visualize them and see the patterns in the chaos. You begin to see the rhythm of the market, the ebb and flow of buying and selling pressures, and the recurring patterns of optimism and pessimism.
Once you can see these patterns and read the market’s hidden language, trading becomes much simpler. You can identify market trends, anticipate turning points, and make more informed trading decisions. In essence, you can navigate the market with greater confidence and ease.
So, if you want to master the art of technical analysis and harness the power of esoteric cycles, start by learning to visualize. Start by learning to see the patterns in the chaos. And remember, trading is not just about numbers and charts. It’s about understanding the market’s hidden language, its hidden rhythms. And that’s where the power of visualization comes in.
Cycle Mastery Unveiled
If you want to delve deeper into esoteric cycles, consider studying Hurst’s cycles. Named after the British engineer J.M. Hurst, who first introduced them in the 1970s, these cycles provide a framework for understanding the cyclical nature of the stock market. Hurst’s cycles are based on the principle that stock market movements are not random but influenced by recurring cycles.
Understanding these cycles can bring you one step closer to mastering the esoteric processes of the market. It can help you identify potential market turning points, allowing you to position yourself for the next market move. It can also provide a deeper understanding of market dynamics, giving you insights into the forces that drive market trends.
However, mastering Hurst’s cycles is not easy. It requires a deep understanding of technical analysis, a keen eye for patterns, and a willingness to delve into the complexities of the market. But don’t be discouraged if you find it challenging at first. The art of technical analysis is a journey, and every journey begins with a single step.
So, take that first step. Start studying Hurst’s cycles. Start exploring the fascinating world of esoteric cycles. And remember, even if you don’t understand everything first, don’t worry. Keep learning, keep exploring, and you’ll gradually unravel the mysteries of the market.
Compelling Pieces for Your Consideration
AMD vs Intel: Who Will Dominate the Landscape going forward

Trading Psychology: The Trend Is Your Friend

AMD Stock Forecast 2023: How MACDs & RSI Signal a Bottom

Mass Hysteria: A Deep Dive into the Phenomenon
Investment strategies for Beginners: Follow The Trend

Technical analysis indicators: Change is in the Air

The Ultimate Guide to Market Psychology Books

The Yen ETF: A Screaming Buy for Long-Term Investors

Stock Market Crash 2020 Predictions: A Tale of Market Resilience

1987 stock market crash: could it happen again?

Securing Your Future: The Power of Long-Term Investments

Disciplined Growth Investors: No Discipline, No Gains

Mastering the Trading Game with the Global Dow Jones Index

US Dollar Index Chart: Bullish Signals for Prolonged Uptrend

Panic Buying Equates to Fools Paradise
Mass Psychology & Financial Success: An Overlooked Connection
Contrarian Thinking: The Power of Challenging the Status Quo
