
Stock market trend 2022
Updated Dec 2022
There is a 50/50 chance that before the Dow trades to new highs, it could shed 1000 to 1500 quickly to give a false impression that the next downward wave has started. Advanced traders can use this pullback to add to their positions or purchase long-term options (6 months or more of time premium) on the Dow via DIA. DIA Jan 2022, 300 calls, for example. Market update August 31, 2020
The Dow has shed more than 1500 points from high to low. When a market sheds weight for three-plus days in a row without any real trigger, the next step is for the market to attempt to put in a bottom. If the current support at 27460 does not hold, then a break of 27K is expected, at least on an intraday basis.
Now the normal reaction for novice traders is to panic at the thought the markets could trend lower. In doing so, vital energy is wasted on viewing an opportunity through a negative lens. Individuals that take this approach are usually like deer frozen in front of a speeding truck. The glare of the headlights impairs their judgement, so even though they could quickly jump out of the way, fear keeps them frozen in place until the inevitable transpires.
Anticipating the Stock Market Trend: Insights and Predictions
Traders driven by fear lose on both ends of the trade; they don’t short the markets or go long. Shorting the markets is not a recommended course of action when the trend is positive. However, at least one attempts to do something instead of letting fear take over. After that harrowing experience, they have nothing to show for it, other than an even larger appetite to be taken to the cleaners at some future date. This is sometimes referred to as the secret desire to lose syndrome. We will explore this concept in some future updates. For now, remember, fear pays poorly.
Many experts are focusing on the high-speed ride many of the stocks in the tech experienced to state that the market is out of sync with the economy and value-based plays will make a comeback. Only plays that appear to be value-based because they have taken a beating due to unfair selling will recoup. Companies that can adapt and deal with the removal of the human element will eventually thrive; stocks in the banking, Airlines and some plays in the transportation sector come to mind. However, companies that don’t adjust and plan for the human decimation factor will not thrive; some will disappear forever.
The stock market is pricing a leaner and more efficient environment, and right now, companies are planning to address this issue by embracing AI-based technologies. Just cutting back and trimming the fat, without considering the AI component will only delay the inevitable.
With so much hot money in the markets, the ride up and down will be volatile; forget about maybe, it will be volatile, so the idea is to focus on the long game. The trend is positive, so whether one likes it or not, one has to embrace pullbacks until the trend turns negative. The stronger the deviation, the better the opportunity
Stock Market Forecast: Analyzing Opportunities and Risks for Investors
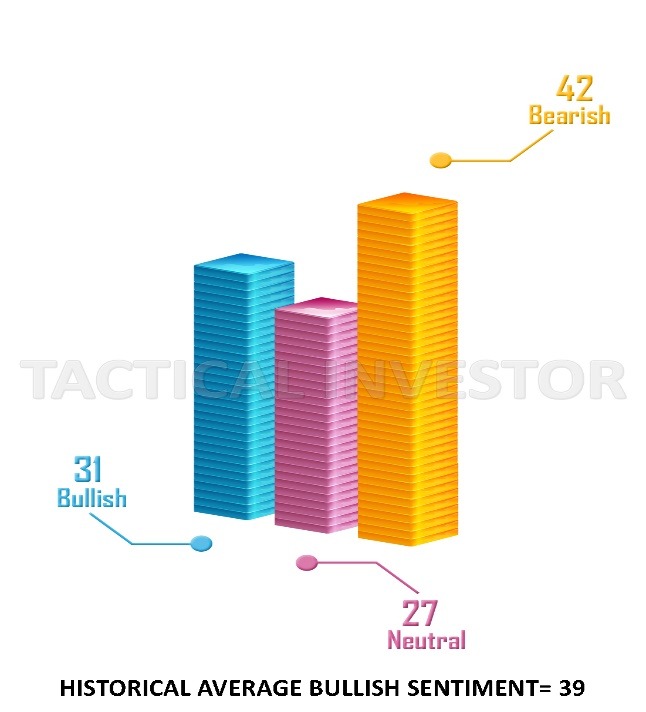
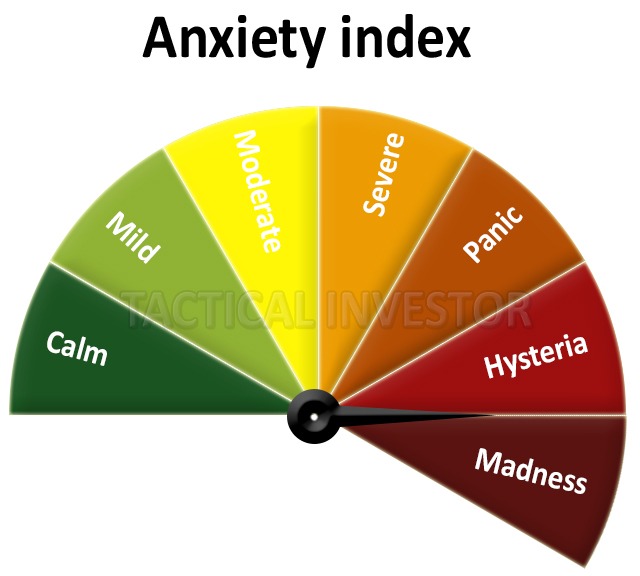
For the 1st time in weeks, the gauge on the anxiety Index has moved out of the madness zone. The masses are still too anxious, which means that every pullback until this needle moves into Mild to Calm area, has to be embraced. Bullish sentiment is still trading below its historical average for almost 30 weeks in a row. Market Update August 31, 2020
Bearish sentiment rose slightly; note that this data was collected before the markets started to sell off. Remarkably Bullish sentiment is now trading below its historical average for over 30 weeks in a row. At the same time, bearish sentiment refuses to drop below 33.00. All in all, this means that no matter what the experts state, every healthy pullback ranging from mild to the wild has to be embraced without exception.
The weekly chart of the Nasdaq
Based on the weekly charts, the Nasdaq is trading in the extremely overbought ranges, but there is no guarantee that the correction will gather momentum as in the monthly charts, it is trading far from the overbought ranges. The Feb-March pullback was an anomaly as the correction was based on mass hysteria. Previous bearish MACD crossovers on the weekly charts did not result in massive pullbacks.
The monthly chart of the Nasdaq
As the Nasdaq is trading a long way from the extremely overbought ranges, it will likely trade into the insanely overbought ranges before the market experiences a sharp pullback. Hence one possible outcome is for the Nasdaq to shed a certain amount of steam and then tread water as the Dow plays catch up. The Dow has still not taken out its old high.
Hence embrace all pullbacks ranging from mild to wild. Market Update August 31, 2020
Based on the sentiment, the amount of money still sitting on the sidelines, psychological indicators and Technical analysis tools, the only possible outcome is to embrace pullbacks. The stronger the deviation, the better the opportunity.
Other Articles of Interest
Tech Trends 2020: The Future of Farming
The death of the Investment guru
Sentiment investing: Mass Psychology Holds the Key
AI trends: The Future is all About AI?
Stock Market Euphoria or Stock Market Insanity
Stock market crash 2020 predictions
US bank stocks and Psychological Ploys in the stock market
US jobless claims No Longer Connected To Stock Market
Easy Money Environment Fosters Price manipulation
