Dow 2008 Crash: is the Dow Going to rally or Crash
This article, originally published on July 10, 2008, has undergone updates over the years, with the latest revision completed in March 2023.
It seems as though everything that could go wrong has indeed gone wrong. Just as it appeared that the markets were poised to stabilize and had factored in much of the negative news, the Dow unexpectedly plummeted, breaching its Jan 08 lows. Before delving into this potentially explosive pattern, consider a few other factors.
As previously mentioned, substantial funds, amounting to over two trillion dollars, are held in money market accounts by undecided investors who have chosen to remain on the sidelines. However, recent events have further spooked these investors, leading them to refrain from deploying their funds into various sectors of the financial markets. Instead, they continue to hold back and observe, waiting for a more favourable climate to re-enter the markets.
Assessing the Violation of the Main Uptrend Line
Compounding the issues, the problems seem to have extended to big institutional investors, particularly the massive sovereign funds, resulting in a temporary loss of even more purchasing power in the markets. When key psychological levels are breached, it negatively impacts the psyche of most investors.
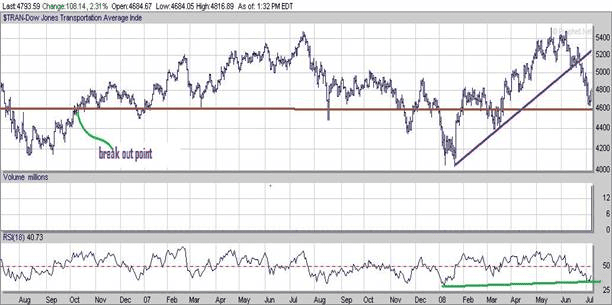
Shifting our focus to the 2-year chart of the Dow transports, we observe that it retraced almost entirely to its initial breakout point in October 2006. The fact that this zone held serves as a definite positive, as first breakout points often provide robust support. However, it’s worth noting that the violation of the main new uptrend line necessitates a surge past 5250 for 18 consecutive days to re-establish this uptrend line. Nonetheless, the recent surge in the Transport, partly influenced by oil’s 8-dollar pullback in just two days, offers some relief.
A negative factor is that the uptrend line was broken after hitting a new high. Though, it is fortunate that this occurred post-new high, as breaking the uptrend line before achieving a new high would have been a highly unfavourable and precarious development. Ideally, the transports should avoid breaking below 4600 for more than six consecutive days. If such a situation arises, it could indicate two things:
1. The oil markets are not yet ready for a substantial correction.
2. Before stabilising, The Dow will likely breach the 11000 barrier and potentially trade as low as the 10650 to 10800 ranges.
Dow 2008 Crash: Oil Sector Signals Impending Market Turmoil
Regarding oil, there are some positive developments for the market; almost all the major stocks in the oil sector have suddenly experienced rather rapid breakdowns. One could almost say they are already pricing at lower oil prices; look how fast APA, BPT, XOM, PBR, YPF, etc., have broken down in the last few days. If one couples this with the fact that Iran is now hoarding millions and millions of barrels of oil in tankers for potentially higher prices, it leads one to believe that a top at least an intermediate top is close at hand.
Mass psychology states that when a market has experienced a massive run-up, and big institutions start to either load up shares or hoard up on the indicated commodity, some sort of top is close. Governments and large institutions are notorious for jumping in towards the end of a run. If we also add in the increased amount of speculation going on in the oil futures markets and the many pundits coming out and stating that one should buy oil on all dips, we feel that the likelihood of a pullback is pretty close at hand. If this should transpire, it will have a substantial positive impact on worldwide markets.
Utilities as a Crucial Indicator Amidst Market Turmoil
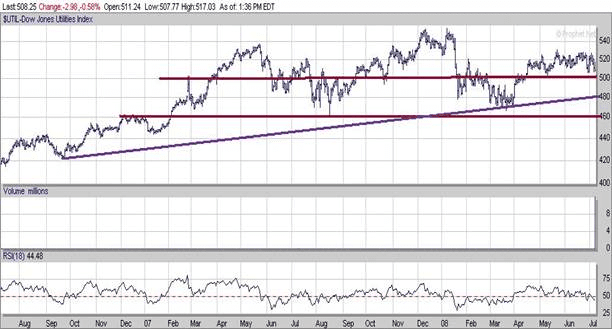
Looking at the two-year chart of the utilities, we see that it is the only one out of the transports and Dow Industrial’s that has not broken below its main up trend line. Now, this is very important, and you might want to know why we feel this way. Firstly according to the TI Dow pattern (do not confuse this with the Dow Theory, which is something completely different), it is the utilities that start the whole process. In other words, they have to go on to put in new highs before the other two indices will follow. Hence it makes sense that if this leader breaks down, it will be bad news for the other two.
Given the massive sell-off, it has held up remarkably well and is trading well above its long-term uptrend line. Technically it could trade all the way down to 460 which would mean a break of the main uptrend line, but if it did this and could trade above the main uptrend line within nine days, then we have nothing to worry about. The chances of it testing the bottom of the channel formation at 460 are less than 40% right now. Another bullish factor is that it has not broken below the top of the current channel formation (495-515 ranges) despite the massive sell-off in the markets.
Dow’s Sharp Decline: Seeking Stability Amidst Oversold Conditions
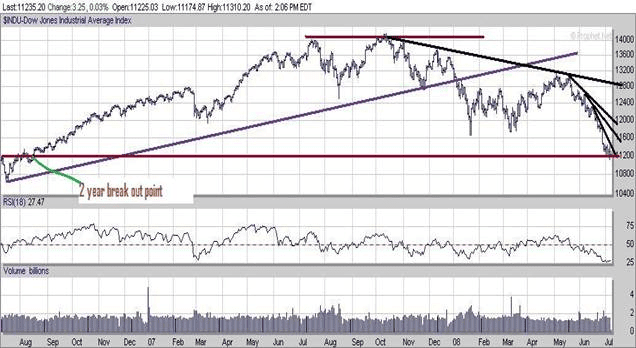
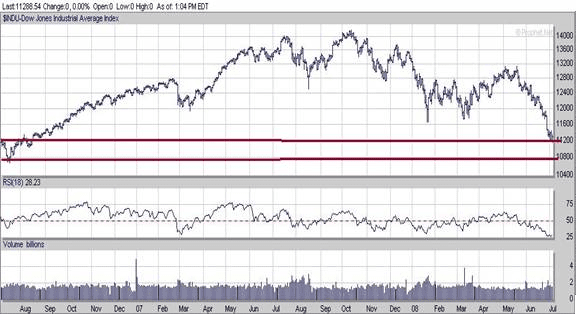
The Dow’s pattern has taken an unappealing turn; initially, a controlled correction suddenly escalated into a rapid-fire pullback, driving the Dow to a low of 11100. As it breached its main uptrend line, a new downtrend line emerged. Furthermore, it swiftly and easily dipped below the Jan 08 lows, faster than we would have preferred; this zone, which should have offered resistance, provided only token opposition before succumbing to the breakdown.
Amidst this, there is a glimmer of positivity as the Dow is now significantly oversold, with four downtrend lines in place and all TA indicators indicating oversold to extremely oversold conditions. It is hovering around its two-year breakout point (approximately 11200), and so far, this zone appears to be holding steady.
Dow’s Crucial Hurdles and Reevaluating Market Strategy
For the Dow’s situation to undergo a significant change, it must first breach the 11400 mark and sustain trading in this zone for at least nine consecutive days. Subsequently, surpassing the 12000 level for six consecutive days will increase the likelihood of breaking through the new downtrend line at 12800 and re-establishing an uptrend.
The recent decisive break below the Jan 08 lows has introduced a shift in the pattern, leading us to consider the possibility of selling and closing many positions, except for key holdings, during the next rally. Our approach is not anchored in stubbornness; we do not hold onto decisions despite the market’s signals. While we have maintained a bullish stance in challenging circumstances, we recognize the importance of adjusting our views based on market realities, setting aside any personal pride or ego-driven biases.
Remaining Objective in Market Analysis: Preparing for Potential Adjustments
To maintain objectivity, we avoid emotional attachments to the markets and refrain from subjective judgments. Should the pattern change, our views will adapt to align with the market’s signals. We acknowledge that we cannot control the market’s actions; our role is to interpret its current state and make informed predictions. While we have accurately predicted market directions in the past, we remain humble and recognize that no one can consistently get it right, and claims of such expertise are misleading.
Now we are not saying that we will have to sell into the upcoming rally, but there is a strong possibility that we might have to close many of our positions. If we are wrong, we can always reopen these positions later on. For now, though, we are on standby for the Jan 08 lows that were violated too easily, and the Dow has traded significantly below them. We will be better positioned to determine the next course of action after the markets have started to rally.
To summarize
- Bullish factors
- Both Dow utilities and transports have not broken below their Jan 08 lows
- Utilities are trending strongly above their main up-trend line
- Even though the transports pulled back, they were able to hold above the first break-out point (Oct 2006)
- Multiple Downtrend lines in the Dow and thus, some rally should begin shortly
- The Dow is holding above its first break-out point in the 2-year chart
- Negatives
- Dow broke too fast and too easily below its Jan 08 lows and has traded significantly below them
Smart money indicator
Thankfully this indicator has been holding up well and is nowhere next to its Jan lows; if it continues to behave in this manner, it might actually go on to issue a full-fledged buy signal. The last signal was a tentative buy signal, as it was 99% into the buy zone but did not fully enter the 100% buy zone. If a full-fledged signal is issued, it has the potential to invalidate almost all the negative factors we have listed; we say almost because we will have to investigate what pattern the markets are putting out when and if it flashes a full-fledged buy. However, it is a relief that it has not reacted to the correction in the same manner the Dow and the NASDAQ have.
Now let’s examine that potentially explosive pattern; it is very interesting because it indirectly substantiates almost everything we stated above.
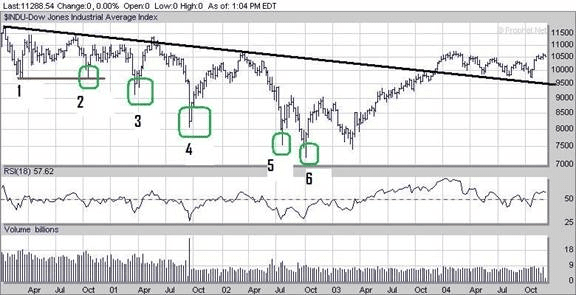
The above chart stretches from March 2000 to Oct 04. The pattern here is eerily similar to the pattern the Dow was currently putting out in 2008; the only difference is the time frame.
After putting in what appeared to be a double bottom (points 1 to 2), the Dow traded lower to point 3 in April 2001. At this point, it looked like a long-term bottom was finally in place; several positive divergence signals were flashed, and our smart money indicator was very close to the buy zone (almost 96% into the buy zone).
Dow’s Rollercoaster Ride: Rallying, Breaking Down, and Searching for Clues
The Dow did go on to mount what appeared to be a powerful rally which took it from 9200 all the way to 11200 in a matter of months. However, the rally broke down, the old lows failed to hold, and the Dow went on to put in yet another low (point 4). Once again, our smart money indicator refused to flash a buy signal even though it was pretty close to the buy zone (almost 93% into the buy one; a full signal is flashed only when it is 100%, and a tentative buy signal is flashed when it is 98-99% in the buy zone).
The markets, however, were extremely oversold, and so they mounted a rather impressive rally that added roughly 2500 points to the Dow before it came to an end, taking the Dow from roughly the 8000 mark to the 10500 mark.
This rally also failed, and the Dow put in yet another new low (point 5); several strong positive divergence signals were flashed, and our smart money indicator was in the neutral zone. (Perhaps this was a clue that a bottom was still not yet in). Once again, after mounting a brief rally, the Dow went on to put in yet another low (point 6); this time around, our smart money indicator flashed a strong buy together with several of our other indicators and several very strong positive divergence signals were also flashed.
Around this time we went on to flash a strong buy on the market. The rally that followed was very strong indeed, taking the Dow from below 7500 all the way to the 10500 plus mark, and then the Dow started to trend sideways.
Comparing Dow 2008 Crash with Current Chart: Striking Similarities and Altered Timelines
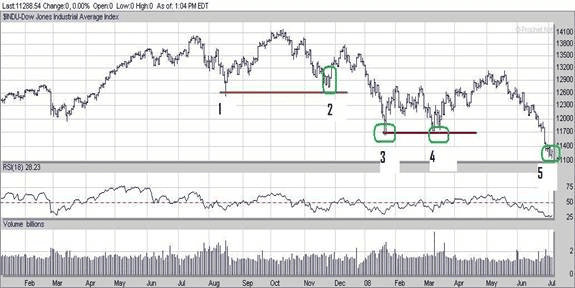
If one looks at the current chart, which roughly spans 18 months, one can immediately see that they are powerful similarities between the two. First of all, we have to say this; nowadays, what used to be years can now occur in as little as a few months, and what used to take months now takes place in weeks and so on. Thus a pattern that took 3-4 years to complete can now complete itself in less than one year.
Notice that points 1 to 2 correspond very well with points 1 to 2 on the 1st chart. On the same token, the Dow went on to put in a new low (point 3) after breaking through what appeared to be a strong double bottom formation; this is precisely what took place in the 1st chart. The only difference is the speed of the reaction; the second time around, everything appears to be taking place two times faster than it did in the first chart.
Up to point 3, the pattern is almost identical; after three, it changes a bit. In the 1st chart, the Dow puts another low (point 4), while here, the Dow puts in what looks like yet another double bottom formation (3 to 4 ).
Deciphering Dow’s Current Chart: Possible Echoes of the 2008 Crash Pattern
Like the first chart point, four did not hold, and the Dow has now traded to a new position (point 5), yet another new low. So far, the patterns are pretty much the same. Now the question we have to ask ourselves is this; will the pattern end here, or will the Dow follow the pattern in chart one completely and go on to generate point 6, which will end up being yet another new low? Before trading to point 6 in Chart 1, the Dow actually rallied 1500 points from roughly 7500 to roughly 9000 (July 02 to Sept 02), which is a gain of 20% in a matter of months. If the Dow had to do the same thing now, it would translate into a rally of roughly 2200 points and take the Dow to the 13500 level.
This rally subsequently failed, and the Dow went on to put in a final new low which in reality was only roughly 300 points lower than the previous low (the difference between point 5 and point 6 on chart 1). Hardly any time elapsed between this new low and the new thunderous rally that followed, one that drove the Dow to gain over 3400 points in a matter of 14 months (Oct 02 to Jan 04); that’s a whopping gain of over 47%.
Other than for a slight pause in the pattern from 3 to 4, the ways are shockingly similar, and thus there is a decent chance we could end up having a point 6 on this chart too. A strong buy signal by our smart money indicator could invalidate the need for point 6. However, should this not happen, we must ask this question; what would point 6 be?
Potential Scenarios for Dow’s Summer Rally Amidst Oversold Conditions
If the price point 11220 is taken out on a weekly basis, it appears that point 6 will fall roughly In the 10650 to 10800 range. If the Dow is to repeat this pattern, then it means that it should mount a rather strong rally relatively soon as the markets are extremely oversold right now.
We have no positive divergence signals right now, but there is one big difference our smart money indicator flashed a tentative buy signal at point 4, and right now, it’s holding up very well even though we are at point 5, which is a new low.
Thus if it is to repeat the same pattern and point 5 is indeed the new low, we should start preparing ourselves for a powerful summer rally. According to this pattern, this rally will fail and take the Dow to yet another low, but before it does, it could yield lovely gains. It is possible that there could be some divergence or that this time around, the pattern could change a bit. Here are two possible scenarios
Point 6 could be avoided if our smart money indicator flashed a solid new buy signal.
Or
Before mounting a robust rally, we trade to a new low, create point 6, and then mount a powerful rally. We would be in favour of the first option, but whatever the outcome, we are going to be studying the ensuing rally very closely to see whether we should use it as a means to close our positions in anticipation of the next strong downward move. A strong buy by the smart money indicator means that the likelihood of trading to point 6 now would be reduced by at least 50%, and if several positive divergence signals were also generated at the same time, it would mean that there would be virtually no chance of the Dow trading to a new low before it mounted a very strong rally.
Finally, we have some negative factors that we need to look at.
The bad news is that the Dow is trading significantly below its Jan 08 lows; last week, we stated that it had to trade back above these levels in 6 days unless the patterns on the Dow transports or utilities indicated otherwise. Well, the bad news is that the Patterns on both the utilities and the vehicles are not strong enough to invalidate the need to trade above the Jan 08 lows, but at the same time, they are not as weak as they were when we first looked at them; they have gained strength in the last few days.
Thus the timeline has now moved from 6 days to 12 days. It could even get more substantial next week, and the timeline could go to neutral, meaning we would not have to trade above a certain level before a specified time frame.
Other bad news is that despite this massive sell-off, the put-call ratio is not spiking significantly, neither is the VIX, and the number of traders shorting shares in odd lots has not jumped significantly either.
Smart Money Indicator Signals Hope Amidst Market Sell-Off
The good news is that despite this massive sell-off, our smart money indicator has not reacted negatively and is trading well above its Jan 08 lows; it is also very close to actually issuing a full-fledged buy signal; the last signal was a tentative buy because it got to within 99% of entering the buy zone but did not quite make it into the 100% mark. The markets are also extremely oversold and are just begging for a reason to rally.
Another negative factor that is impossible to price in is the possibility of an attack on Iran. A war with Iran will send the price of oil to the moon, and it will have far-reaching implications for the entire world’s economy and on all the financial markets.
Dow 2008 Crash Conclusion
The pattern that the Dow put in from 2001 to 2004 bears an uncanny resemblance to the current pattern, and we feel that there is an excellent chance that based on this pattern, we could witness a relatively strong summer rally. Once this rally matures, we will have to determine whether we should sell into this rally and close almost all our positions except for uranium’s or continue to hold our positions; if the Dow follows its old pattern, the pullback could be very hard indeed.
Other than a war breaking out with Iran, we feel that the markets are poised to rally as they are extremely oversold. If this rally is on the same scale as that on chart one, it could drive the Dow well past 13500 before ending.
So far, we experienced seven selling climaxes in just a matter of weeks; this represents a rather large number of selling climaxes in a relatively short period, and thus at the very least, some sort of relief rally should follow. A selling climax is when the down volume accounts for 90% or more of the total volume. Dow; Explosive pattern or Impending doom; for now, we think it could be spelling doom. What do you think? A strong correction would make for an excellent buying opportunity and spell opportunity in the long term. Thus the answer depends on your time frame.
New Comments On Dow 2008 Crash(July 25th, 2008)
Since the initial writing of this article, the Dow experienced a decline below the 11000 level, reaching an intraday low of 10872 before finding stability. Interestingly, the transports also broke below 4600, accompanied by a surge in volume, surpassing 7.4 billion, marking a new record. This selling frenzy resulted in widespread dumping of assets, indicating a significant market turning point. However, based on the subsequent rally, it appears that some level of bottoming has occurred, at least for the time being. Another positive sign was the VIX spiking past 30 for the first time in months.
Notably, oil has sharply pulled back in just a few days, dropping around 24 dollars in less than two weeks, leading to a bullish market response. The Dow rallied approximately 850 points from its low on July 15th to its recent high on July 23rd before experiencing a pullback. Now, we must observe whether the previously mentioned pattern will be repeated or potentially violated.
Leave this hypocritical prating about the masses. Masses are rude, lame, unmade, pernicious in their demands and influence, and need not to be flattered but to be schooled. I wish not to concede anything to them, but to tame, drill, divide, and break them up, and draw individuals out of them.
Ralph Waldo Emerson, 1803-1882, American Poet, Essayist
Interesting Reads

Beat Inflation: Insights from Philosophers and Contrarian Investors

Market Timing Strategies: Debunking Flawless Predictions

Smart Moves: How to Stop losing Money and Brew Success

How to Beat Inflation: Conquering the Silent Killer Tax

The Moment of Truth: Predicting the Fed’s Pivot in Monetary Policy

When is the best time to invest in stocks? Amidst the Storm of Panic
Stock Market Timing Signals: Challenges Traders Often Misinterpret

Prosperity’s Mindgame: The Happy Investor’s Long-Term Strategy

Navigating Turbulent and Prosperous Times: How to Be a Good Investor

The Hidden Hand: Exposing Media’s Mastery in Swinging Public Sentiment

Technical Analysis Pattern Essentials: Deciphering the Market’s Hidden Language

Cultivating Wealth: The Virtue of Patience in Investment Success

What are some psychological biases that act as barriers to effective decision making?
Which of the Following Is the Biggest Pitfall of Economic Indicators: Analysis

Silver and Gold Bull: Charging-Poised for a Powerful Move
BIIB stock Price: Is it time to buy
Stock market crashes timelines
Dow theory no longer relevant-Better Alternative exists
Apple Stock Predictions For 2020 and Beyond
In 1929 the stock market crashed because of
