
We can be knowledgeable with other men’s knowledge, but we cannot be wise with other men’s wisdom. ~Michel de Montaigne
Updated May 2020
Stock Market Graph: Interesting Patterns
When one looks at 1-3 year charts, one can miss the larger picture and mistakenly come to the conclusion that all is well. This is why it is imperative that one look at both the long term and short term charts. We at Tactical Investor have our modified version of the Dow Theory which has proved to incredibly accurate and useful to us over the past 11 years. Our version of the theory places most of the emphasis on the Dow utilities. In essence, the utilities must lead the way up or down and not languish.
Everything looks pretty fine when one examines five-year charts of the Dow industrials, and Dow transports, but things change when one looks at the Dow utilities.
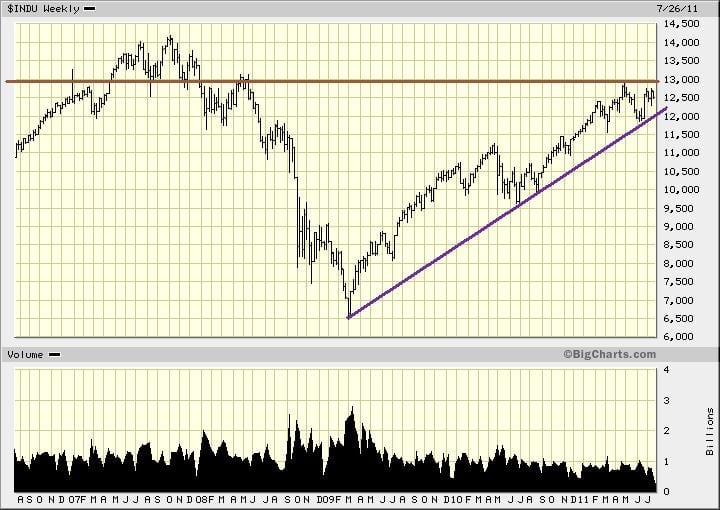
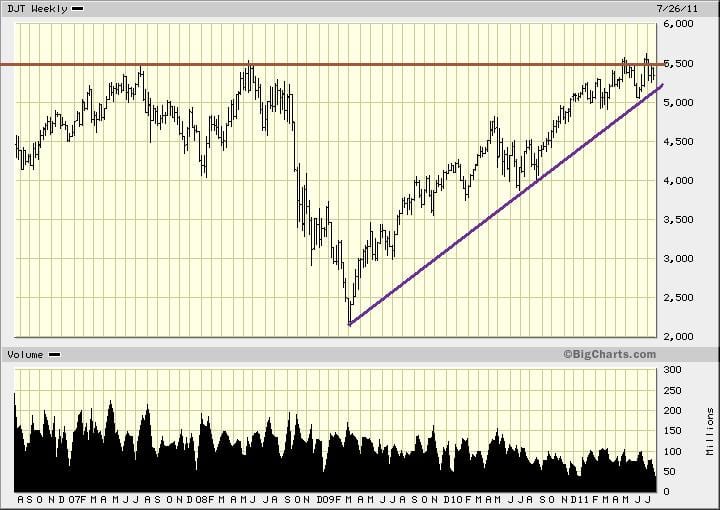
The charts of the Dow industrials and Dow transports both look relatively decent
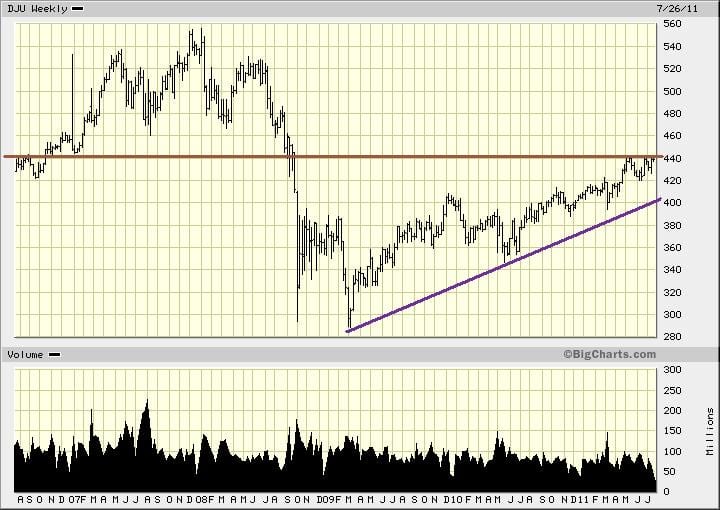
The Dow is roughly 10% away from testing its five-year highs, and the transports are more or less trading at their five years high. The picture is considerably different from the Utilities. While everything looks great in the 1-3 year charts, a five-year chart clearly illustrates that all is not well. The utilities are trading well off their five-year highs; in fact, they would have to mount a stunning rally to test their five-year highs. From their current levels, they would need to rally a whopping 29% to test their five-year highs. Instead of leading, the utilities are clearly languishing. The fact that the utilities have not even managed to trade past their Nov-Dec 2008 lows illustrates how weak they are.
Conclusion
The utilities are clearly indicating that the long-term outlook is rather dire. They have not even managed to trade past their Nov-Dec 2008 lows. Instead of leading the way up, it appears that they are languishing. Perhaps their inability to break out suggests that they might be leading the way down. Could this be a harbinger of what lies in store for the markets in the months to come? We, therefore, feel that there is another stronger washout move necessary to flush out the eager bulls before a bottom is in place.
Stock Market Graph of Dow and Trend Projections
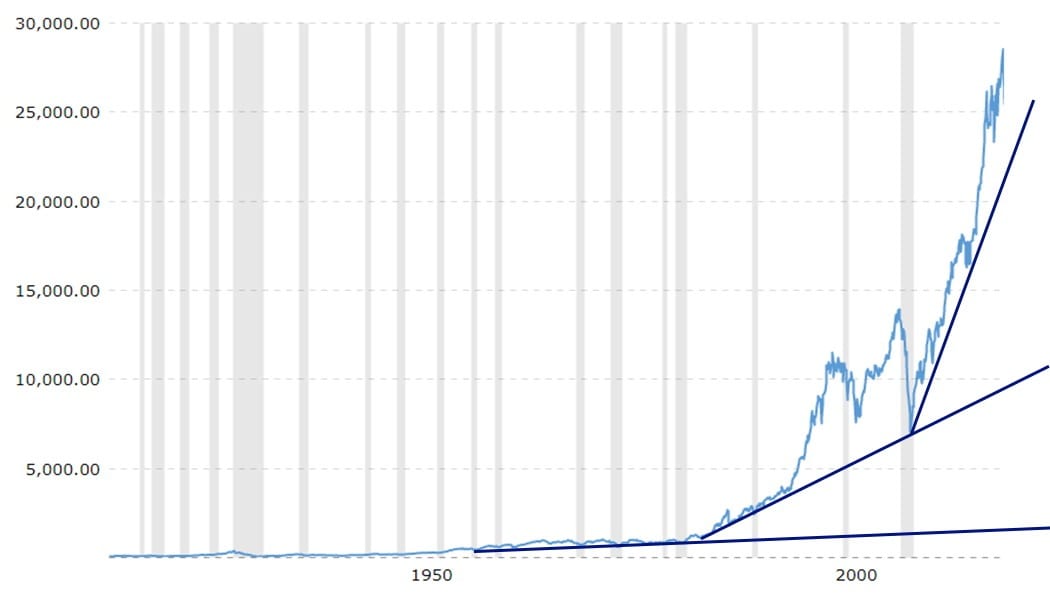
The markets are refusing to pull back, after experiencing one of the shortest bear markets in history. At this point both the bulls, the bears and the neutrals are losing money. All three camps feel that this rally has gotten ahead of itself and therefore the Dow is likely to test the 28,000 ranges before pulling back.
One thing to keep in mind is that no matter how much manipulation there is one cannot change long term patterns. Therefore if the markets don’t pull back now, they will pull back at a future date, albeit more sharply and from a higher point.
Stock Market Outlook

A monthly close above 3290 will set in a pace a move to new highs. In other words, once the SPX closes above this level the path will be set in stone for the sp500 to trend towards new highs. And a monthly close above 3510 will set in motion a test of the 4370 to 4500 ranges. Astute players should view all strong pullbacks through a bullish lens.
Every man is a damn fool for at least five minutes every day; wisdom consists in not exceeding the limit. ~Elbert Hubbard
Other Articles of Interest
A clear Illustration of the Mass Mindset In Action
Inductive Versus Deductive reasoning
Comic Strip Illustrating Mass Mindset
Mass Psychology or Contrarian Investing
