
Master Market Mayhem: Stockta Indicators for Opening Longs in the Throes of Panic
Updated Feb 28, 2024
The stock market can be chaotic, but it’s a playground of opportunities for the discerning investor. To master this game, one must look beyond the surface and employ a holistic understanding of market dynamics. This is where Multi-Time Frame Analysis comes into play—a powerful concept utilized by some of the best chartists.
Multi-Time Frame Analysis is a versatile technique that can be applied using various technical analysis tools. The beauty of this approach lies in its adaptability; you can choose two or three technical indicators that resonate with your trading style. For instance, a harmonious combination might include the Relative Strength Index (RSI) for oversold conditions, Moving Averages for trend identification, and Fibonacci Retracements for potential support and resistance levels.
This comprehensive method dissects market trends across various time frames, from the frenetic hourly charts to the more leisurely daily, weekly, and monthly intervals. Investors can uncover enduring trends and make more informed decisions by examining extended periods, such as months or even years.
The essence of Multi-Time Frame Analysis is finding agreement between different time frames. When you see alignment, it’s like witnessing the stars aligning, providing a cosmic signal for a sound and safe investment strategy. For example, when the daily, weekly, and monthly charts all indicate a bullish trend, the odds of a successful long position increase significantly.
At the heart of this approach is the recognition that market trends are not singular entities; they are interconnected across time frames. By analyzing hourly charts, you capture the market’s pulse, while weekly and monthly charts offer a broader perspective, revealing the underlying current that shapes the market’s direction.
The Tactical Investor embraces a unique approach, merging the precision of Technical Analysis with the insights of Mass Psychology. We believe that understanding market sentiment is just as crucial as deciphering charts. By applying Multi-Time Frame Analysis, our traders gain a nuanced perspective, allowing them to make strategic moves backed by a solid grasp of market behaviour.
So, why settle for simplistic analysis when you can delve deeper and harness the power of Multi-Time Frame Analysis? Elevate your trading game, uncover hidden patterns, and make informed decisions with this versatile approach. Join us on this exciting journey as we navigate the turbulent yet rewarding world of stock market investing.”
Short to Intermediate-Term Trading Success with Stockta
Using multi-time frame analysis, stock technical analysis can achieve unparalleled precision and effectiveness. This method involves scrutinizing market behaviour across various time frames—hourly to monthly—to develop a robust and risk-averse trading strategy.
Expert Insights on Multi-Time Frame Analysis
Dr. John Murphy, a renowned technical analyst and author, advocates for Multi-Time Frame Analysis, citing that “confirmations across multiple time frames can drastically increase the accuracy of trend signals.” Murphy’s research highlights that when both short and long-term indicators agree, the probability of a successful trade increases significantly.
Linda Bradford Raschke, another leading technical analysis figure, emphasises this method’s practical application. She notes, “By harmonizing the signals from various charting periods, traders can filter out the ‘noise’ that often leads to costly mistakes.” Raschke often combines moving averages and momentum oscillators across different time frames to pinpoint optimal trading windows.
Guidelines for Effective Multi-Time Frame Analysis
Daily Charts: Analyze at least one year’s worth of data, with each bar representing one day. This depth allows for detecting enduring trends and seasonal patterns.
– Weekly Charts: A minimum of five years of data is crucial, with each bar reflecting a week’s activity. This broader view helps identify long-term performance trends and cyclical fluctuations.
– Monthly Charts: Reviewing ten years’ worth of data, represented monthly, offers insights into overarching market cycles and major shifts in investor sentiment.
Short-term traders gain valuable insights from hourly and daily charts, identifying immediate entry and exit points based on short-lived trends and reversals. Conversely, long-term traders derive more value from weekly and monthly charts, highlighting sustained trends and stability away from the market’s day-to-day volatility.
The strategic alignment of technical indicators across these time frames is essential. For instance, a simultaneous oversold signal on hourly and daily charts can suggest a potent buying opportunity for short-term positions. Similarly, for long-term positions, alignment in weekly and monthly indicators can signal robust entry points for either long or short trades, depending on whether they indicate oversold or overbought conditions.
At the Tactical Investor, we integrate Crowd Psychology with advanced Technical Analysis to develop the Trend Indicator—a predictive tool that not only forecasts market trends but also provides traders with a preemptive strategy for stock selection. This approach has proven effective in enhancing the timing and accuracy of trades, ensuring our clients are always a step ahead in the market.
Unlocking the Power of Stockta: A Guide to Chart Sources
Regarding stock technical analysis (TA), having access to reliable and comprehensive charting tools is crucial. These tools can help you visualize market trends, identify patterns, and make informed trading decisions. Here are some of the top chart sources you might consider:
Trading View: Known for its user-friendly interface and powerful charting capabilities, it is a popular choice among technical analysts. It offers a cost-effective, feature-rich service that provides excellent value compared to other paid charting services.
Stock Charts: While it has functionality similar to Trading View, Stock Charts come with a higher price point. However, if you want a free service, it’s a good source for basic charting needs.
Big Charts: This free charting service provides various charting tools and features. It’s a good option for those who want to perform fundamental technical analysis without investing in a paid service.
freestockcharts: This platform offers real-time charting and various technical analysis tools. It’s a good option for those who want to perform in-depth analysis without paying for a premium service.
Google Charts: Google Charts is a versatile, free tool that allows you to create various charts for your data. It’s a good option for those who want a simple, straightforward charting tool.
For futures traders, there are also several charting tools available:
Trading view commodity and futures charts**: Trading View offers comprehensive charting tools for commodities and futures in addition to its stock charting capabilities. This makes it a one-stop shop for all your charting needs.
futures.tradingcharts.com: This site provides various charting tools designed explicitly for futures trading. It’s a good option for those who specialize in trading futures.
Remember, the best charting tool for you will depend on your specific needs and trading strategy. It’s always a good idea to try a few different options to see which works best for you.
Final thoughts on Multi-time frame analysis
Most players don’t base their investment decisions on logic; they based them on emotion. Emotions are what drive the markets. Thus if you understand what emotion is gripping the markets you can come out ahead of the crowd. Sol Palha
Investors can achieve even more excellent results in their Stock Technical Analysis by incorporating the study of emotions and crowd behaviour. Understanding how emotions drive market trends can give an advantage over those relying solely on technical analysis.
The Trend Indicator we use at the Tactical Investor exemplifies how Technical Analysis and Mob Psychology can be blended to produce more accurate results. This tool predicts the trend in advance and gives ample time to make investment decisions before the masses even realize there might be a change in the market.
Additionally, the focus should be on the weekly and monthly charts, as they provide a more comprehensive view of the market trends. Investors can decide when to enter long or short positions by waiting until both charts align.
In conclusion, combining Multi-Time Frame Analysis with the study of groupthink psychology can enhance the results of Stock Technical Analysis. By staying ahead of the herd, investors can make investment decisions more confidently and potentially achieve greater returns.
Navigating History: Lessons Learned and Strategies Unveiled
Peering into history yields a twofold advantage. First, it imparts wisdom, preventing the repetition of past errors. Second, it unveils the evolution of our strategies, affirming our prowess at aligning words with actions in the ever-shifting financial landscape. Thus, from this point on, let’s explore the topic through the lens of history.
Stock Technical Analysis Indicators: Market Update July 2019
The markets are entering into what could be an irrational phase. How is this possible when so many players are sitting out? Today’s markets are entirely different from yesteryear’s, so one must be ready to look at the situation from various angles. This hypothesis is based on examining the game’s current pool of players with skin. This group could be getting ahead of themselves; already invested investors could be over-allocating funds because they have moved from the bullish phase to the euphoric stage. Many are just sitting on the sidelines or betting against the market.
It is not a long-term negative development, but if our hypothesis is valid, it could result in a sharp pullback over a short period. Over-exuberant individuals are the first ones to get nervous the moment it looks like the situation is changing. However, this pullback will be a blessing in disguise as there is not enough firepower to “crash” the markets, and the sentiment is far from bullish. Net-Net is a long-term positive development.
New Thoughts on The Markets Jan 2020
The markets are trading in the extremely overbought ranges on the weekly charts, so they will likely pull back/consolidate. Therefore, traders should understand that the media will use any event to blame the correction, and then, if it happens to be stronger than they expected, they will start using the term “crash.”
Other events will be blamed for the pullback/correction if it is not the coronavirus. The current sell-off was so minuscule that it was not worth paying attention to. We would only start to look closer if the Dow shed north of 1000 points, and we would not be in the least worried even if it were to shed 2,500 points. The trend is bullish, so sharp pullbacks should be embraced.
We feel the media is doing its best to push the “fear envelope” to the max regarding the coronavirus epidemic. Before anyone jumps to conclusions and thinks that we are downplaying the situation, consider the following data:
8200 people died in the US during the 2019-2020 flu season; these are preliminary estimates from the CDC. http://bit.ly/2O7iuhU
Data, Data: it means everything when it comes to investing
The coronavirus fatality rate is currently 3%, and to date, there have been 106 fatalities worldwide. When you look at the data from that angle, the common flu would appear to be a pandemic in comparison. The outlook could worsen, but as one can see from the data, the media, as usual, takes delight in stampeding the crowd.
New subscribers can now see in real-time why we issue entry points that appear to make no sense at first glance, as we were triggered into several plays over the last few days. An investor is supposed to get into the stock at the best possible price; this means we should pay less for the stock the moment it is deemed a buy unless the stock is already trading at a steep discount.
If the pullback gathers momentum, don’t make the same mistake you made last time; don’t flee for the hills and that is SOP (standard operating procedure) for the masses, and the reward is usually a swift kick in the……, add whatever choice words that come to your mind, but the outcome is typically unpleasant.
Additionally, if the markets do sell off, use this opportunity to take notes on what is going through your mind. A trading dairy, especially during times of turmoil, provides revealing data that one can use to improve one’s trading strategy in the months and years to come.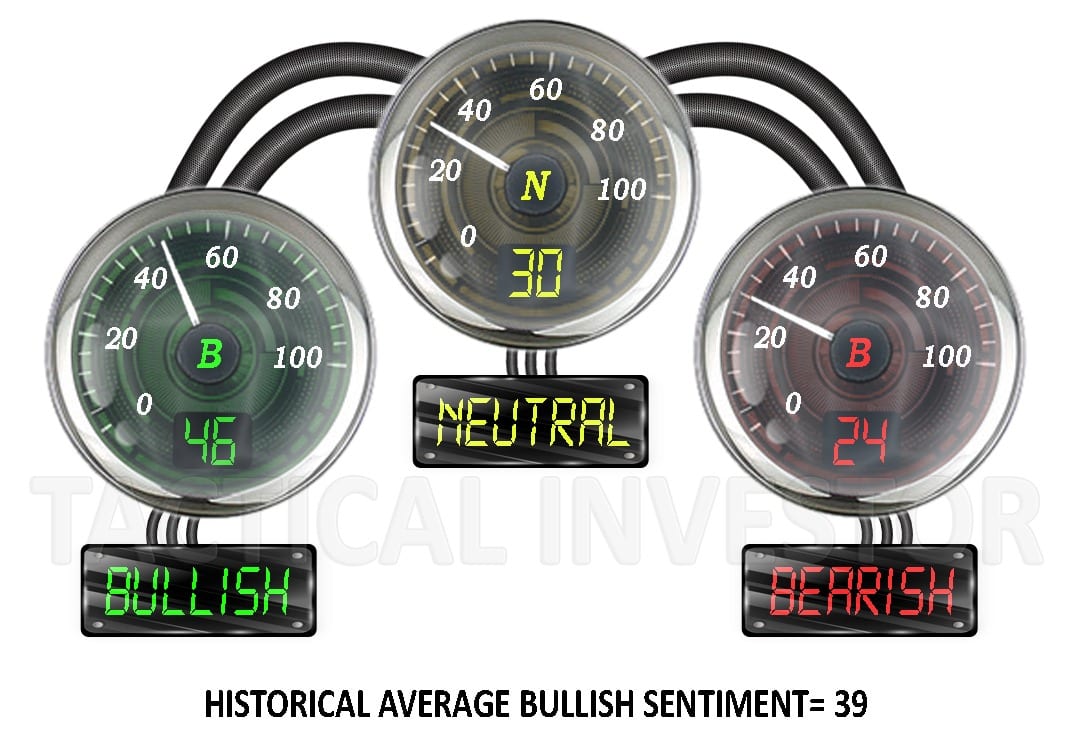
Bullish sentiment before the pullback stood at 46%, so it will be interesting to see what effect the pullback will have on market sentiment. The next update will be sent out on or before the 31st of January.
Debating the Power: The Impact of Stockta Systems Unveiled
Similarly, momentum strategies, which rely on indicators like moving averages and RSI, are profitable in generating above-average returns, particularly in small-cap and value stocks. Moreover, technical analysis can also help identify shifts in market psychology, such as fear and greed, that can influence stock prices.
However, this is not to say that technical analysis is a panacea for predicting stock prices. Critics argue that it may be based on outdated assumptions and prone to biases and errors. Moreover, the effectiveness of technical analysis may vary depending on market conditions and the specific stocks being analyzed.
Conclusion
Technical analysis is practical but not foolproof. Please don’t rely on it alone. Combine with other sources for informed decisions. Understand market dynamics such as investor sentiment, geopolitical factors and seasonality.
Research validating the effectiveness of Stock Technical Analysis Indicators.
These articles provide empirical evidence that supports the effectiveness of technical analysis in predicting stock price movements and generating profits.
- Do Technical Trading Rules Generate Profits? Evidence from Developed and Emerging Markets” by Amin and Lee, published in the Journal of Financial Markets in 2017. This study found that technical trading rules can generate significant profits in developed and emerging markets.
- “Momentum Has Its Moments” by Fama and French was published in the Journal of Finance in 2012. This study examined the effectiveness of momentum strategies in U.S. equity markets and found that they can generate significant abnormal returns.
- “Market Sentiment and Stock Returns” by Baker and Wurgler, published in the Journal of Financial Economics in 2007. This study found that market sentiment can significantly impact stock prices and that sentiment indicators can help predict future returns.
- “The Interaction Between Technical and Fundamental Analysis: Evidence from the Australian Stock Market” by Armitage et al., published in the Journal of Behavioral Finance in 2016. This study found that combining technical and fundamental analysis can improve investment performance in the Australian stock market.
- “Risk Management with Technical Analysis” by Brock et al., published in the Journal of Futures Markets in 1992. This study found that using technical analysis to set stop-loss orders can effectively manage risk in futures markets.
Beyond the Headlines: Articles That Offer In-Depth Analysis

Why is investing in a mutual fund less risky than investing in a particular company’s stock?

What is a Bull Market? Unleashing its Power

Elliot Wave Theory: Navigating the Pitfalls

AI Takeover Theory: Humanity’s Crossroads with AI’s Future Impact

Financial Freedom vs Financial Independence: Your Wake-Up Call to Take Control

The Power of Investing: Key to Early Retirement and Well-Being

The Audacious Rise: How much has the stock market gone up in 2016

Palladium History: Pursuing Profitable Trends

From Zero to Stock Market Hero: Stock Investing for Dummies PDF

Percentage of Americans That Own Stock: Unlocking the Data

Real Estate Investing for Dummies: The Straightforward Path to Building Wealth

Tantalizing Uranium Stocks Soaring: A Contrarian Perspective

Refinement and Riches: Uncover the Luxurious World of Financial Freedom Books

Wisdom in Reverse: Learning the Hard Way How to Lose Money in Stocks

Clear-Cut Investing: Distinguishing Fundamental Analysis from Technical Analysis
How to build wealth in 6 steps (March 28)
The difference between great and mediocre comes down to freedom (March 24)
Another Name for Fake News Is Misinformation (March 20)
Fear equates to Stock Market Buying Opportunity
Great books on life and Investing: Short, sweet & Simple
