
Deciphering the Value of Technical Analysis Indicators: Useful or Useless?
Updated May 2023
Technical analysis indicators are not foolproof and can lose effectiveness as market conditions change. It’s essential to constantly monitor and evaluate the efficacy of your indicators to ensure they still provide accurate signals. Adapting and finding new tools more relevant to the current market environment is essential when an indicator is no longer functional.
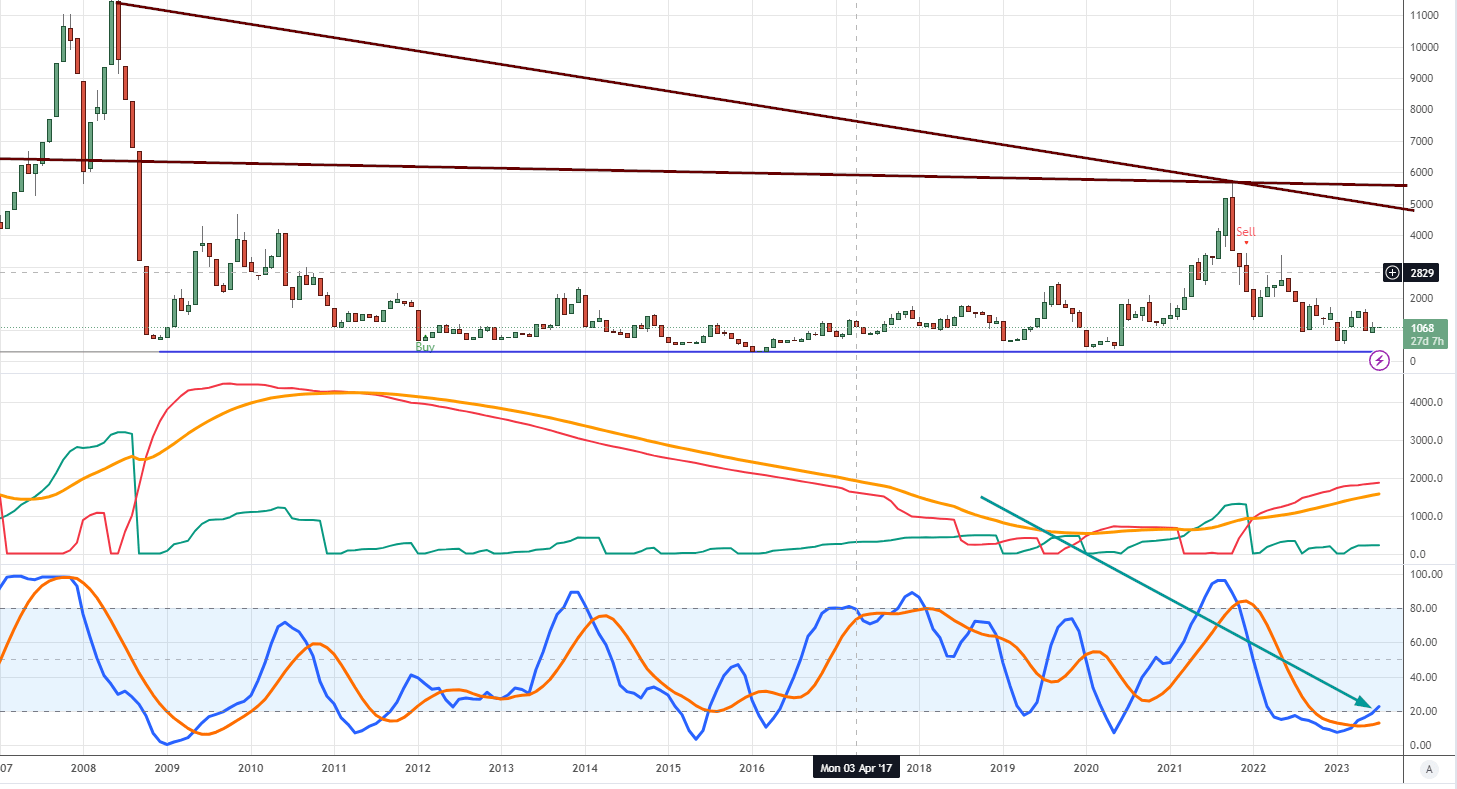
Let’s delve into the historical perspective of the Baltic Dry Index (BDI) from 2011 to 2015 and then examine its current state. The chart below shows that the BDI experienced a consistent downtrend during that period, signalling underlying issues. However, despite the BDI’s inability to surpass even 50% of its peak in May 2008, around 11,800 points, the stock market continued its upward trajectory. This discrepancy led some to dismiss the BDI as ineffective or irrelevant, as it failed to provide accurate results.
To some extent, this claim holds true. However, a deeper analysis reveals that the reason for the BDI’s failure lay in the Federal Reserve’s manipulation of the markets through the infusion of cheap money. By flooding the markets with virtually unlimited funds, the Fed could circumvent the BDI’s influence. Consequently, any indicator can be rendered useless in the presence of such substantial inflows of hot money. It is worth noting that the Fed possesses access to an unlimited supply of funds.

Navigating the Baltic Dry Index (BDI) in 2023
The Baltic Dry Index (BDI) currently trades at a staggering 90% below its peak in 2008, indicating clear signs of economic distress. Consequently, the Federal Reserve faces the challenge of injecting liquidity into the markets while simultaneously combating inflation. The BDI’s message suggests that the global economy is weak, prompting the need for the Fed to intervene by flooding the markets with money.
However, adopting a contrarian perspective and incorporating Mass Psychology into the equation reveals a potentially positive outlook. According to Mass Psychology, one should consider taking actions opposite to what the majority is doing, especially when the prevailing sentiment aligns with their course of action. In this case, the BDI’s dire outlook aligns with Mass Psychology, suggesting a contrary opportunity.
As previously mentioned, the Fed’s policies since 2015 have resulted in limited efficacy of the BDI as an indicator. Nevertheless, the data can still be utilized from a contrarian standpoint to strategize accordingly. In this particular instance, it implies that any market sell-off should be embraced rather than feared.
Engaging Read: Technical Analysis Of Stocks And Commodities
Critical Crossroads for the Baltic Index: A Defining Moment
One cannot fret over this; one has to adapt, bringing one of the essential sayings of the Tactical Investor to mind ” adapt or die”.
The Baltic Dry Index (BDI) was a reliable indicator of where the markets were headed. It would often top out or bottom out before the markets did, making it one of the select few technical analysis indicators consistently producing results.
However, this is no longer the case. The BDI, which worked well over the decades, is now useless and probably not good enough to use as toilet paper. It continues to trade at new lows, and the market continues to soar to new highs, proving market manipulation. Rather than fretting over this, it is crucial to adapt. At Tactical Investor, the saying “adapt or die” is essential.

A Fascinating read: Does Technical Analysis Work? Unveiling The Truth
Two Economic Indicators: Comeback Or Burial Time?
Copper has historically been a reliable indicator of the economy’s direction, but it is no longer as useful due to the changing global economic landscape. The old rules and laws no longer apply as we enter a new phase of the worldwide currency wars. The market is in a state of maximum overdrive, and traders must adapt or die. The markets and copper prices no longer move in lockstep, and traders must be careful not to be misled by traditional indicators.
The current situation requires traders to be open-minded and embrace the new paradigm, even if it is difficult to understand. The market movements are not random but the result of calculated planning by those in power. It is essential to pay attention to the perceptions of others and plan accordingly to come out on top in any given situation.
Technical Analysis: how to make it work for you
Economists like to take simple concepts and make them complex to hide their ignorance. Sol Palha
It’s a pity that two technical analysis indicators that were once powerful have lost their effectiveness and have become obsolete due to the manipulations in the financial markets. The reality we live in today is distorted, and people tend to believe in data provided by the media rather than trusting their instincts. It’s crucial to understand that people’s perception of the truth is what matters, not necessarily the truth itself.
By understanding their perception, one can plan a course of action that leads to a positive outcome. The Masters of Deception have become more blatant in their efforts, and it’s important to see reality from their eyes to be on top of any situation. Listening to people’s songs can reveal they’re true beliefs, and paying attention to their answers can help uncover their perspective.
While there are certainly cases where complex language is used to obfuscate rather than elucidate, it is also true that some topics are inherently tricky and require a nuanced understanding. Experts in a particular field may use specialized language to communicate more precisely with their peers. Still, it is also essential to communicate effectively with a broader audience. In general, clear and straightforward language is usually preferable, allowing more people to understand and engage with the presented ideas.
Technical Analysis Indicators: Is it Time for Copper to Make a Comeback?

In 2022, copper prices hit record highs, indicating that the global economy was not dire. Instead, it resulted from poor political decisions by world leaders, with the United States’ policies being a prime example. Despite a brief setback, copper remained steady and surged beyond the 4.50 mark, revealing that issues with inflation and supply were merely symptoms of bad policies.
As a result, copper is gaining momentum and is set to trade past 4.50; this also means that the market will be range-bound for years, posing a challenge for long-term investors who focus on indices. However, this presents an excellent opportunity for traders who can use market psychology and technical analysis to their advantage.
Leading economic indicators are crucial for trading as they provide valuable insights into the future state of the economy, allowing traders to make informed decisions. In conclusion, traders who can effectively use these tools can potentially benefit from the current copper market and make a killing.
Originally published on September 16, 2020, and consistently updated thereafter, with the most recent update completed in May 2023.
Originally written on April 15, 2015, this piece has been regularly updated over the years, with the most recent update occurring in March 2023.
FAQ
Q: Are technical analysis indicators foolproof?
A: Technical analysis indicators are not foolproof and can lose effectiveness as market conditions change.
Q: Why is it important to constantly monitor and evaluate indicators?
A: It’s essential to constantly monitor and evaluate the efficacy of indicators to ensure they still provide accurate signals.
Q: What should one do when an indicator is no longer functional?
A: When an indicator is no longer functional, adapting and finding new tools more relevant to the current market environment is important.
Q: What was the historical trend of the Baltic Dry Index (BDI) from 2011 to 2015?
A: The BDI experienced a consistent downtrend from 2011 to 2015, indicating underlying issues.
Q: Did the stock market continue to rise despite the BDI’s performance during that period?
A: The stock market continued its upward trajectory despite the BDI failing to surpass even 50% of its peak in May 2008.
Q: What was the reason behind the BDI’s failure as an indicator?
A: The Federal Reserve’s manipulation of the markets through the infusion of cheap money rendered the BDI ineffective.
Q: How did the Fed’s actions impact the BDI’s influence?
A: The Fed’s flooding of the markets with virtually unlimited funds circumvented the BDI’s influence.
Q: What is the current state of the BDI in 2023?
A: The BDI currently trades at a significant decline, approximately 90% below its peak in 2008, indicating economic distress.
Q: What perspective can be applied to the BDI’s dire outlook?
A: A contrarian perspective, incorporating Mass Psychology, suggests that opportunities may arise from the BDI’s negative outlook.
Q: How have the Fed’s policies affected the BDI’s efficacy?
A: Since 2015, the Fed’s policies have limited the BDI’s effectiveness as an indicator.
Q: How can the data from the BDI be utilized from a contrarian standpoint?
A: From a contrarian standpoint, the BDI data indicates that market sell-offs should be embraced rather than feared.
Q: What is the Tactical Investor’s approach to market fluctuations?
A: The Tactical Investor emphasizes the need to adapt to market fluctuations and the saying “adapt or die” holds significance.
Q: Is the BDI still a reliable indicator of the economy’s direction?
A: No, the BDI’s reliability as an indicator of the economy’s direction has diminished due to changing global economic dynamics.
Q: Why is embracing a new market analysis paradigm crucial?
A: The market movements are no longer governed by traditional indicators, and adapting to the new paradigm is essential.
Q: What is the significance of understanding people’s perceptions in planning a course of action?
A: Understanding people’s perceptions can help plan a course of action that leads to a positive outcome in market analysis.
Q: What was the outlook for copper prices in 2022?
A: Copper prices hit record highs in 2022, indicating that the global economy was not dire but impacted by poor political decisions.
Q: How can traders benefit from the current copper market?
A: Traders who can effectively use market psychology and technical analysis may benefit from the current copper market.
Articles That Nourish the Intellect and the Soul

Projected Silver Prices: Setting Sail for Precious Metal Ascension

Stock Bubble: Act Quickly or Lag Behind

Perception Manipulation: Mastering the Market with Strategic Insight

Contrarian Outlook: A Pathway to Breakthrough or Breakdown

Market Uncertainty: A Challenge for Investors

Stock market basics for beginners: Adapt or Die

The Unfortunate Truth: Why Covered Calls are a Bad Strategy

DJU Index: To Buy or Flee? Unraveling the Market Mystery

Stock Market Psychology 101: Learn, Thrive, and Profit

In 1929 the Stock Market Crashed Because of Greed

Palladium Forecast: Unveiling the Stealth Bull Market

Unshackling Minds: The Journey to Remove Brainwashing

Mastering the Trading Range: Unlocking the Potential for Explosive Gains

Unveiling the VIX Fear Indicator: A Case Study in Market Volatility

Mind Games: Unmasking Brainwashing Techniques in Institutions & Media
Pack mentality- Never be part of the pack if you want to win
Is The U.S.A Still A Super Power? (Oct 25)
China; A Great Time To Buy (Oct 25)
Not Time To Short The Markets Yet As Long-Term Trend Still Intact (Oct 24)
Dollar Bull Still In Play (Oct 24)
Market Trend is up and all pullbacks are buying opportunities (Oct 2)
Gold Approaching Critical Juncture (Sept 30)
Copper at make or break point (Sept 27)
A New Era In Trading (Jan 25, 2014)
Two Key Indicators No Longer Work
Two Key IndiExtracted in part from April 15, 2015, market Updatecators No Longer Work
